29
/
en
AIzaSyAYiBZKx7MnpbEhh9jyipgxe19OcubqV5w
April 1, 2024
62370
World
WLD
false
2
1
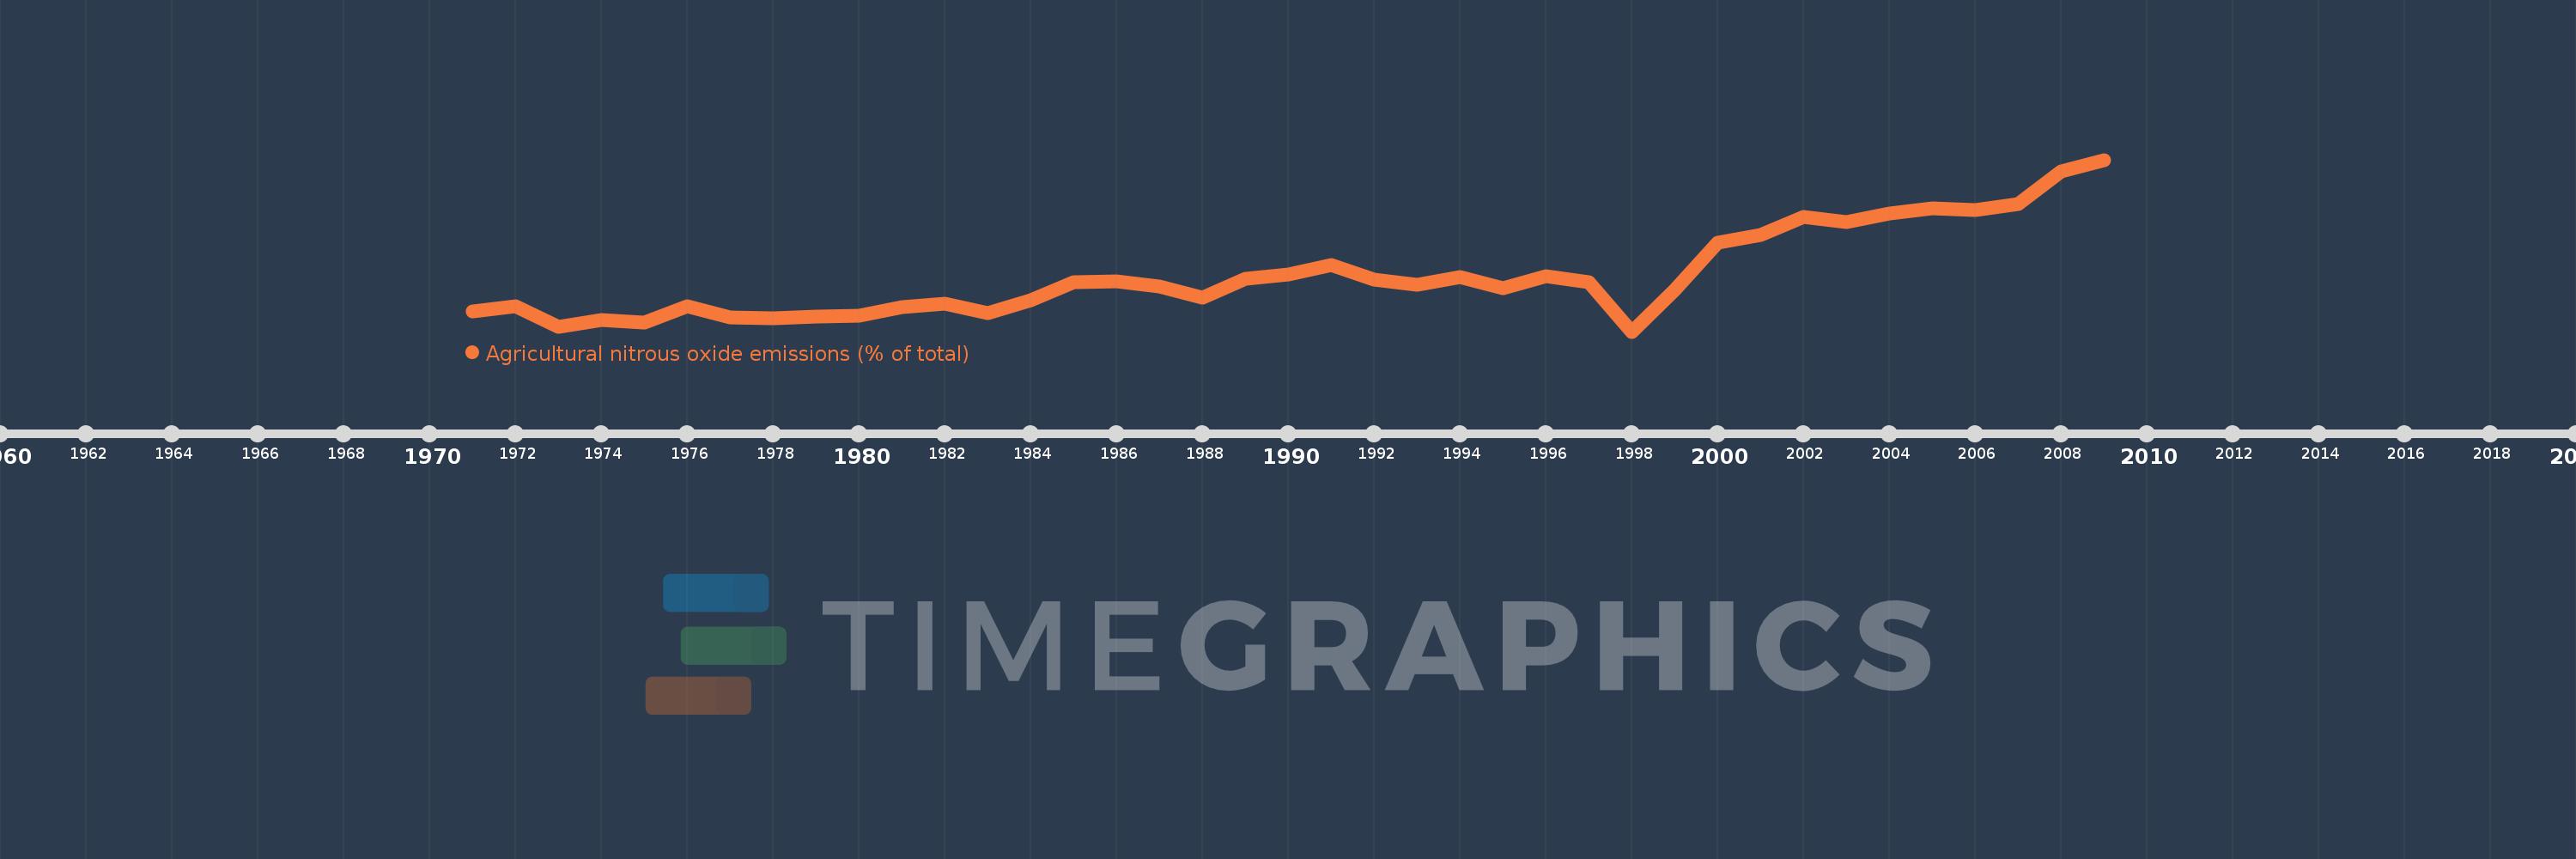
Agricultural nitrous oxide emissions (% of total)
2009,2008,2007,2006,2005,2004,2003,2002,2001,2000,1999,1998,1997,1996,1995,1994,1993,1992,1991,1990,1989,1988,1987,1986,1985,1984,1983,1982,1981,1980,1979,1978,1977,1976,1975,1974,1973,1972,1971
This statistics in other country:
AfghanistanAlbaniaAlgeriaAmerican SamoaAndorraAngolaAntigua and BarbudaArab WorldArgentinaArmeniaArubaAustraliaAustriaAzerbaijanBahamas, TheBahrainBangladeshBarbadosBelarusBelgiumBelizeBeninBermudaBhutanBoliviaBosnia and HerzegovinaBotswanaBrazilBritish Virgin IslandsBrunei DarussalamBulgariaBurkina FasoBurundiCabo VerdeCambodiaCameroonCanadaCaribbean small statesCayman IslandsCentral African RepublicCentral Europe and the BalticsChadChileChinaColombiaComorosCongo, Dem. Rep.Congo, Rep.Costa RicaCote d'IvoireCroatiaCubaCyprusCzech RepublicDenmarkDjiboutiDominicaDominican RepublicEarly-demographic dividendEast Asia & PacificEast Asia & Pacific (excluding high income)East Asia & Pacific (IDA & IBRD countries)EcuadorEgypt, Arab Rep.El SalvadorEquatorial GuineaEritreaEstoniaEthiopiaEuro areaEurope & Central AsiaEurope & Central Asia (excluding high income)Europe & Central Asia (IDA & IBRD countries)European UnionFaroe IslandsFijiFinlandFragile and conflict affected situationsFranceFrench PolynesiaGabonGambia, TheGeorgiaGermanyGhanaGibraltarGreeceGreenlandGrenadaGuamGuatemalaGuineaGuinea-BissauGuyanaHaitiHeavily indebted poor countries (HIPC)High incomeHondurasHong Kong SAR, ChinaHungaryIBRD onlyIcelandIDA & IBRD totalIDA blendIDA onlyIDA totalIndiaIndonesiaIran, Islamic Rep.IraqIrelandIsraelItalyJamaicaJapanJordanKazakhstanKenyaKiribatiKorea, Dem. People’s Rep.Korea, Rep.KuwaitKyrgyz RepublicLao PDRLate-demographic dividendLatin America & Caribbean Latin America & Caribbean (excluding high income)Latin America & the Caribbean (IDA & IBRD countries)LatviaLeast developed countries: UN classificationLebanonLesothoLiberiaLibyaLithuaniaLow & middle incomeLow incomeLower middle incomeLuxembourgMacao SAR, ChinaMacedonia, FYRMadagascarMalawiMalaysiaMaldivesMaliMaltaMarshall IslandsMauritaniaMauritiusMexicoMicronesia, Fed. Sts.Middle East & North AfricaMiddle East & North Africa (excluding high income)Middle East & North Africa (IDA & IBRD countries)Middle incomeMoldovaMongoliaMoroccoMozambiqueMyanmarNamibiaNauruNepalNetherlandsNew CaledoniaNew ZealandNicaraguaNigerNigeriaNorth AmericaNorthern Mariana IslandsNorwayOECD membersOmanOther small statesPacific island small statesPakistanPalauPanamaPapua New GuineaParaguayPeruPhilippinesPolandPortugalPost-demographic dividendPre-demographic dividendPuerto RicoQatarRomaniaRussian FederationRwandaSamoaSao Tome and PrincipeSaudi ArabiaSenegalSerbiaSeychellesSierra LeoneSingaporeSlovak RepublicSloveniaSmall statesSolomon IslandsSomaliaSouth AfricaSouth AsiaSouth Asia (IDA & IBRD)SpainSri LankaSt. Kitts and NevisSt. LuciaSt. Vincent and the GrenadinesSub-Saharan Africa Sub-Saharan Africa (excluding high income)Sub-Saharan Africa (IDA & IBRD countries)SudanSurinameSwazilandSwedenSwitzerlandSyrian Arab RepublicTajikistanTanzaniaThailandTimor-LesteTogoTongaTrinidad and TobagoTunisiaTurkeyTurkmenistanTurks and Caicos IslandsTuvaluUgandaUkraineUnited Arab EmiratesUnited KingdomUnited StatesUpper middle incomeUruguayUzbekistanVanuatuVenezuela, RBVietnamVirgin Islands (U.S.)WorldYemen, Rep.ZambiaZimbabwe Timeline:
This timeline shows a graph from 1971 to 2009 of World. No data until 1970. Number of actual observations by date: 39.
Source name:
World Development Indicators
Source organization:
World Bank staff estimates from original source: European Commission, Joint Research Centre (JRC)/Netherlands Environmental Assessment Agency (PBL). Emission Database for Global Atmospheric Research (EDGAR): http://edgar.jrc.ec.europa.eu/.
Categories, topics:
Agriculture & Rural Development, Environment
Last updated:
apr 23, 2017
Indicators value changes by year
Minimum:
56.005
jan 1, 1998
Maximum:
70.046
jan 1, 2009
At the date of observation
Value
Absolute change
Change from previous value
jan 1, 1971
57.651
+57.651
0.0%
jan 1, 1972
58.062
+0.411
0.71%
jan 1, 1973
56.364
-1.699
-2.93%
jan 1, 1974
56.975
+0.612
1.09%
jan 1, 1975
56.743
-0.232
-0.41%
jan 1, 1976
58.054
+1.312
2.31%
jan 1, 1977
57.13
-0.924
-1.59%
jan 1, 1978
57.093
-0.037
-0.06%
jan 1, 1979
57.207
+0.114
0.2%
jan 1, 1980
57.288
+0.081
0.14%
jan 1, 1981
58.009
+0.721
1.26%
jan 1, 1982
58.319
+0.31
0.53%
jan 1, 1983
57.498
-0.821
-1.41%
jan 1, 1984
58.59
+1.092
1.9%
jan 1, 1985
60.026
+1.436
2.45%
jan 1, 1986
60.138
+0.111
0.19%
jan 1, 1987
59.673
-0.465
-0.77%
jan 1, 1988
58.782
-0.891
-1.49%
jan 1, 1989
60.342
+1.56
2.65%
jan 1, 1990
60.696
+0.354
0.59%
jan 1, 1991
61.467
+0.772
1.27%
jan 1, 1992
60.218
-1.25
-2.03%
jan 1, 1993
59.858
-0.359
-0.6%
jan 1, 1994
60.462
+0.603
1.01%
jan 1, 1995
59.517
-0.945
-1.56%
jan 1, 1996
60.53
+1.014
1.7%
jan 1, 1997
60.021
-0.51
-0.84%
jan 1, 1998
56.005
-4.016
-6.69%
jan 1, 1999
59.437
+3.433
6.13%
jan 1, 2000
63.285
+3.848
6.47%
jan 1, 2001
63.883
+0.598
0.94%
jan 1, 2002
65.407
+1.523
2.38%
jan 1, 2003
64.966
-0.441
-0.67%
jan 1, 2004
65.672
+0.707
1.09%
jan 1, 2005
66.08
+0.407
0.62%
jan 1, 2006
65.953
-0.126
-0.19%
jan 1, 2007
66.41
+0.457
0.69%
jan 1, 2008
69.12
+2.71
4.08%
jan 1, 2009
70.046
+0.926
1.34%
Ranking of countries by current statistics by years


Comments: