29
/
en
AIzaSyAYiBZKx7MnpbEhh9jyipgxe19OcubqV5w
April 1, 2024
82439
Belize
BLZ
true
2
1
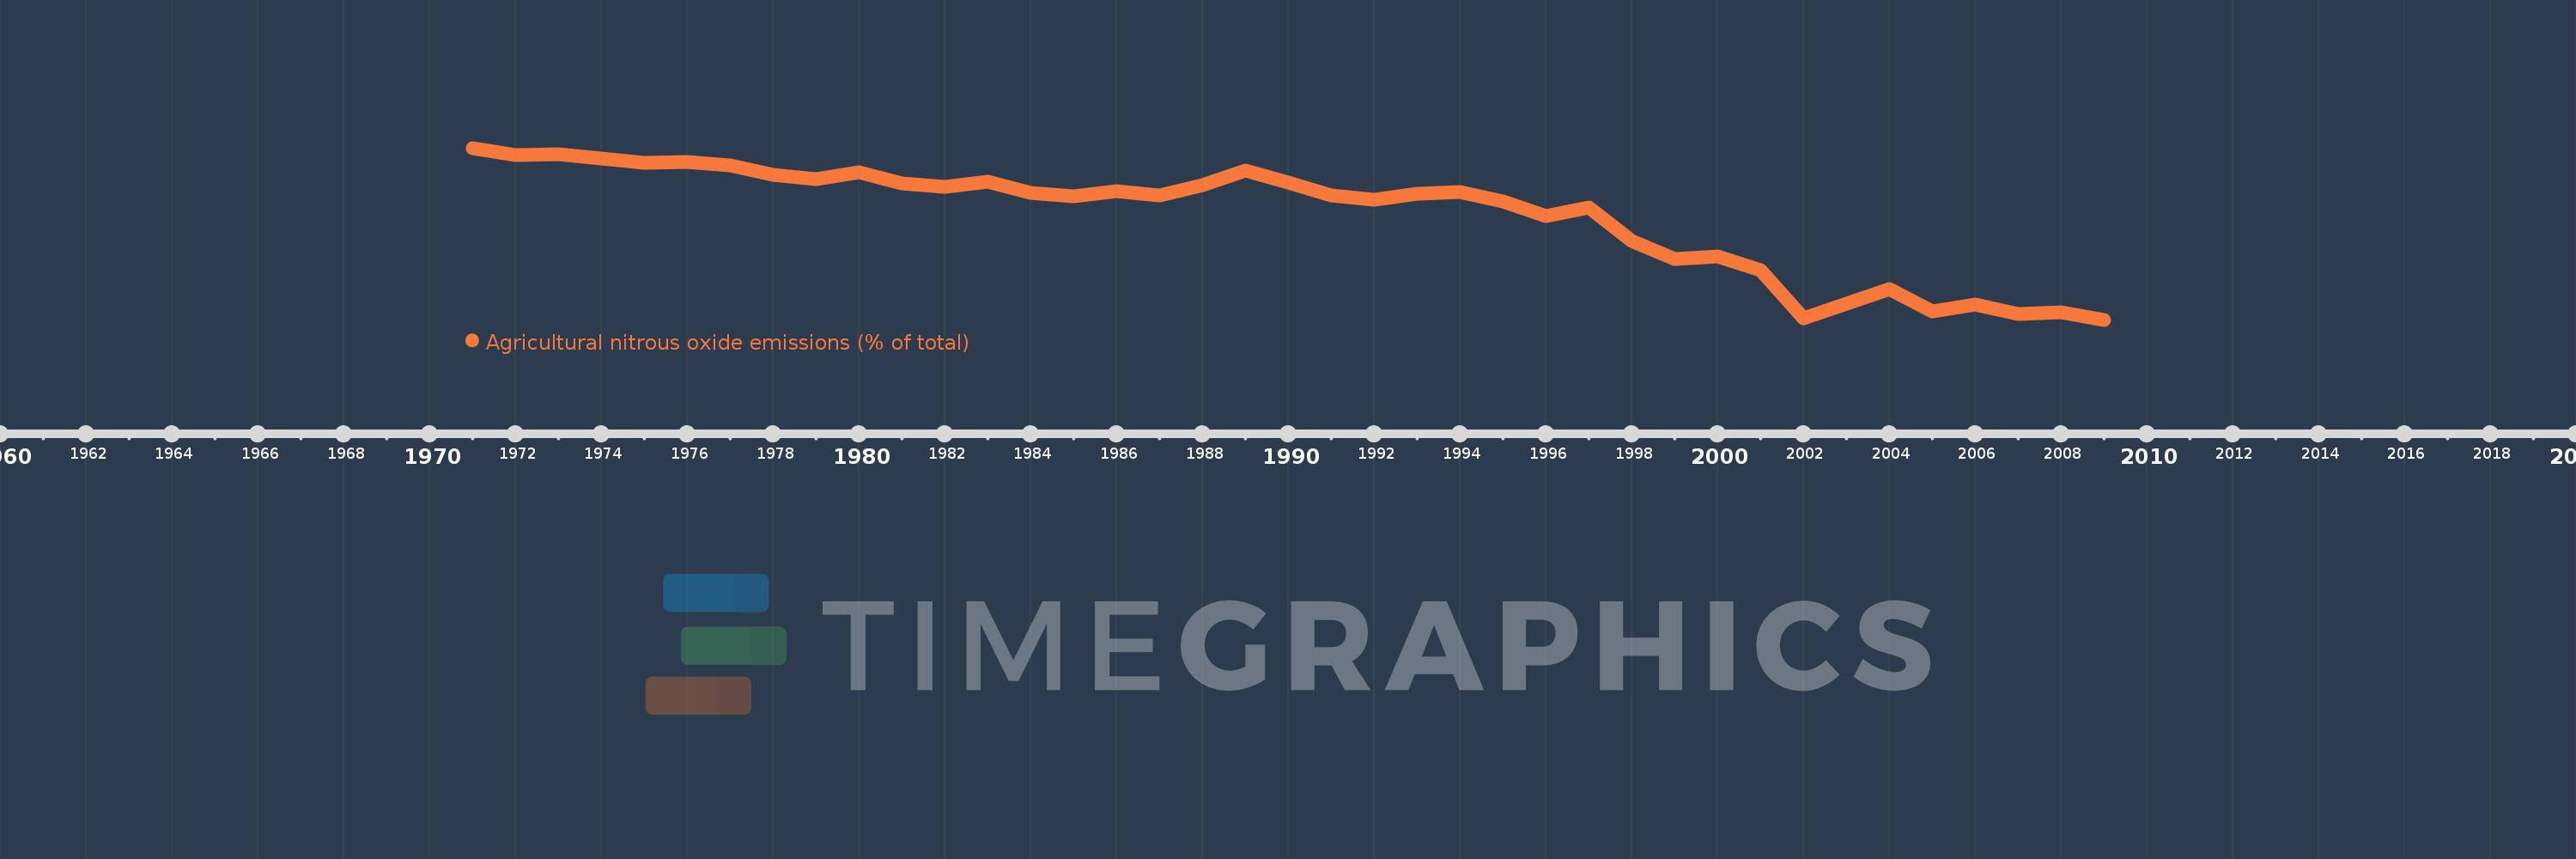
Agricultural nitrous oxide emissions (% of total)
2009,2008,2007,2006,2005,2004,2003,2002,2001,2000,1999,1998,1997,1996,1995,1994,1993,1992,1991,1990,1989,1988,1987,1986,1985,1984,1983,1982,1981,1980,1979,1978,1977,1976,1975,1974,1973,1972,1971
This statistics in other country:
AfghanistanAlbaniaAlgeriaAmerican SamoaAndorraAngolaAntigua and BarbudaArab WorldArgentinaArmeniaArubaAustraliaAustriaAzerbaijanBahamas, TheBahrainBangladeshBarbadosBelarusBelgiumBelizeBeninBermudaBhutanBoliviaBosnia and HerzegovinaBotswanaBrazilBritish Virgin IslandsBrunei DarussalamBulgariaBurkina FasoBurundiCabo VerdeCambodiaCameroonCanadaCaribbean small statesCayman IslandsCentral African RepublicCentral Europe and the BalticsChadChileChinaColombiaComorosCongo, Dem. Rep.Congo, Rep.Costa RicaCote d'IvoireCroatiaCubaCyprusCzech RepublicDenmarkDjiboutiDominicaDominican RepublicEarly-demographic dividendEast Asia & PacificEast Asia & Pacific (excluding high income)East Asia & Pacific (IDA & IBRD countries)EcuadorEgypt, Arab Rep.El SalvadorEquatorial GuineaEritreaEstoniaEthiopiaEuro areaEurope & Central AsiaEurope & Central Asia (excluding high income)Europe & Central Asia (IDA & IBRD countries)European UnionFaroe IslandsFijiFinlandFragile and conflict affected situationsFranceFrench PolynesiaGabonGambia, TheGeorgiaGermanyGhanaGibraltarGreeceGreenlandGrenadaGuamGuatemalaGuineaGuinea-BissauGuyanaHaitiHeavily indebted poor countries (HIPC)High incomeHondurasHong Kong SAR, ChinaHungaryIBRD onlyIcelandIDA & IBRD totalIDA blendIDA onlyIDA totalIndiaIndonesiaIran, Islamic Rep.IraqIrelandIsraelItalyJamaicaJapanJordanKazakhstanKenyaKiribatiKorea, Dem. People’s Rep.Korea, Rep.KuwaitKyrgyz RepublicLao PDRLate-demographic dividendLatin America & Caribbean Latin America & Caribbean (excluding high income)Latin America & the Caribbean (IDA & IBRD countries)LatviaLeast developed countries: UN classificationLebanonLesothoLiberiaLibyaLithuaniaLow & middle incomeLow incomeLower middle incomeLuxembourgMacao SAR, ChinaMacedonia, FYRMadagascarMalawiMalaysiaMaldivesMaliMaltaMarshall IslandsMauritaniaMauritiusMexicoMicronesia, Fed. Sts.Middle East & North AfricaMiddle East & North Africa (excluding high income)Middle East & North Africa (IDA & IBRD countries)Middle incomeMoldovaMongoliaMoroccoMozambiqueMyanmarNamibiaNauruNepalNetherlandsNew CaledoniaNew ZealandNicaraguaNigerNigeriaNorth AmericaNorthern Mariana IslandsNorwayOECD membersOmanOther small statesPacific island small statesPakistanPalauPanamaPapua New GuineaParaguayPeruPhilippinesPolandPortugalPost-demographic dividendPre-demographic dividendPuerto RicoQatarRomaniaRussian FederationRwandaSamoaSao Tome and PrincipeSaudi ArabiaSenegalSerbiaSeychellesSierra LeoneSingaporeSlovak RepublicSloveniaSmall statesSolomon IslandsSomaliaSouth AfricaSouth AsiaSouth Asia (IDA & IBRD)SpainSri LankaSt. Kitts and NevisSt. LuciaSt. Vincent and the GrenadinesSub-Saharan Africa Sub-Saharan Africa (excluding high income)Sub-Saharan Africa (IDA & IBRD countries)SudanSurinameSwazilandSwedenSwitzerlandSyrian Arab RepublicTajikistanTanzaniaThailandTimor-LesteTogoTongaTrinidad and TobagoTunisiaTurkeyTurkmenistanTurks and Caicos IslandsTuvaluUgandaUkraineUnited Arab EmiratesUnited KingdomUnited StatesUpper middle incomeUruguayUzbekistanVanuatuVenezuela, RBVietnamVirgin Islands (U.S.)WorldYemen, Rep.ZambiaZimbabwe Timeline:
This timeline shows a graph from 1971 to 2009 of Belize. No data until 1970. Number of actual observations by date: 39.
Source name:
World Development Indicators
Source organization:
World Bank staff estimates from original source: European Commission, Joint Research Centre (JRC)/Netherlands Environmental Assessment Agency (PBL). Emission Database for Global Atmospheric Research (EDGAR): http://edgar.jrc.ec.europa.eu/.
Categories, topics:
Agriculture & Rural Development, Environment
Last updated:
apr 23, 2017
Indicators value changes by year
Minimum:
72.392
jan 1, 2009
Maximum:
89.896
jan 1, 1971
At the date of observation
Value
Absolute change
Change from previous value
jan 1, 1971
89.896
+89.896
0.0%
jan 1, 1972
89.2
-0.696
-0.77%
jan 1, 1973
89.227
+0.027
0.03%
jan 1, 1974
88.844
-0.383
-0.43%
jan 1, 1975
88.385
-0.459
-0.52%
jan 1, 1976
88.471
+0.086
0.1%
jan 1, 1977
88.094
-0.377
-0.43%
jan 1, 1978
87.131
-0.963
-1.09%
jan 1, 1979
86.707
-0.424
-0.49%
jan 1, 1980
87.385
+0.678
0.78%
jan 1, 1981
86.31
-1.075
-1.23%
jan 1, 1982
85.926
-0.384
-0.44%
jan 1, 1983
86.49
+0.564
0.66%
jan 1, 1984
85.312
-1.178
-1.36%
jan 1, 1985
85.011
-0.301
-0.35%
jan 1, 1986
85.501
+0.489
0.58%
jan 1, 1987
85.098
-0.403
-0.47%
jan 1, 1988
86.107
+1.009
1.19%
jan 1, 1989
87.601
+1.494
1.74%
jan 1, 1990
86.397
-1.204
-1.37%
jan 1, 1991
85.082
-1.315
-1.52%
jan 1, 1992
84.616
-0.467
-0.55%
jan 1, 1993
85.255
+0.639
0.76%
jan 1, 1994
85.406
+0.151
0.18%
jan 1, 1995
84.45
-0.956
-1.12%
jan 1, 1996
82.959
-1.491
-1.77%
jan 1, 1997
83.807
+0.848
1.02%
jan 1, 1998
80.422
-3.385
-4.04%
jan 1, 1999
78.613
-1.809
-2.25%
jan 1, 2000
78.804
+0.191
0.24%
jan 1, 2001
77.443
-1.361
-1.73%
jan 1, 2002
72.56
-4.883
-6.31%
jan 1, 2003
74.037
+1.477
2.04%
jan 1, 2004
75.476
+1.438
1.94%
jan 1, 2005
73.222
-2.253
-2.99%
jan 1, 2006
73.919
+0.697
0.95%
jan 1, 2007
72.984
-0.935
-1.26%
jan 1, 2008
73.13
+0.145
0.2%
jan 1, 2009
72.392
-0.738
-1.01%
Ranking of countries by current statistics by years


Comments: