29
/
en
AIzaSyAYiBZKx7MnpbEhh9jyipgxe19OcubqV5w
April 1, 2024
276366
United States
USA
true
2
1
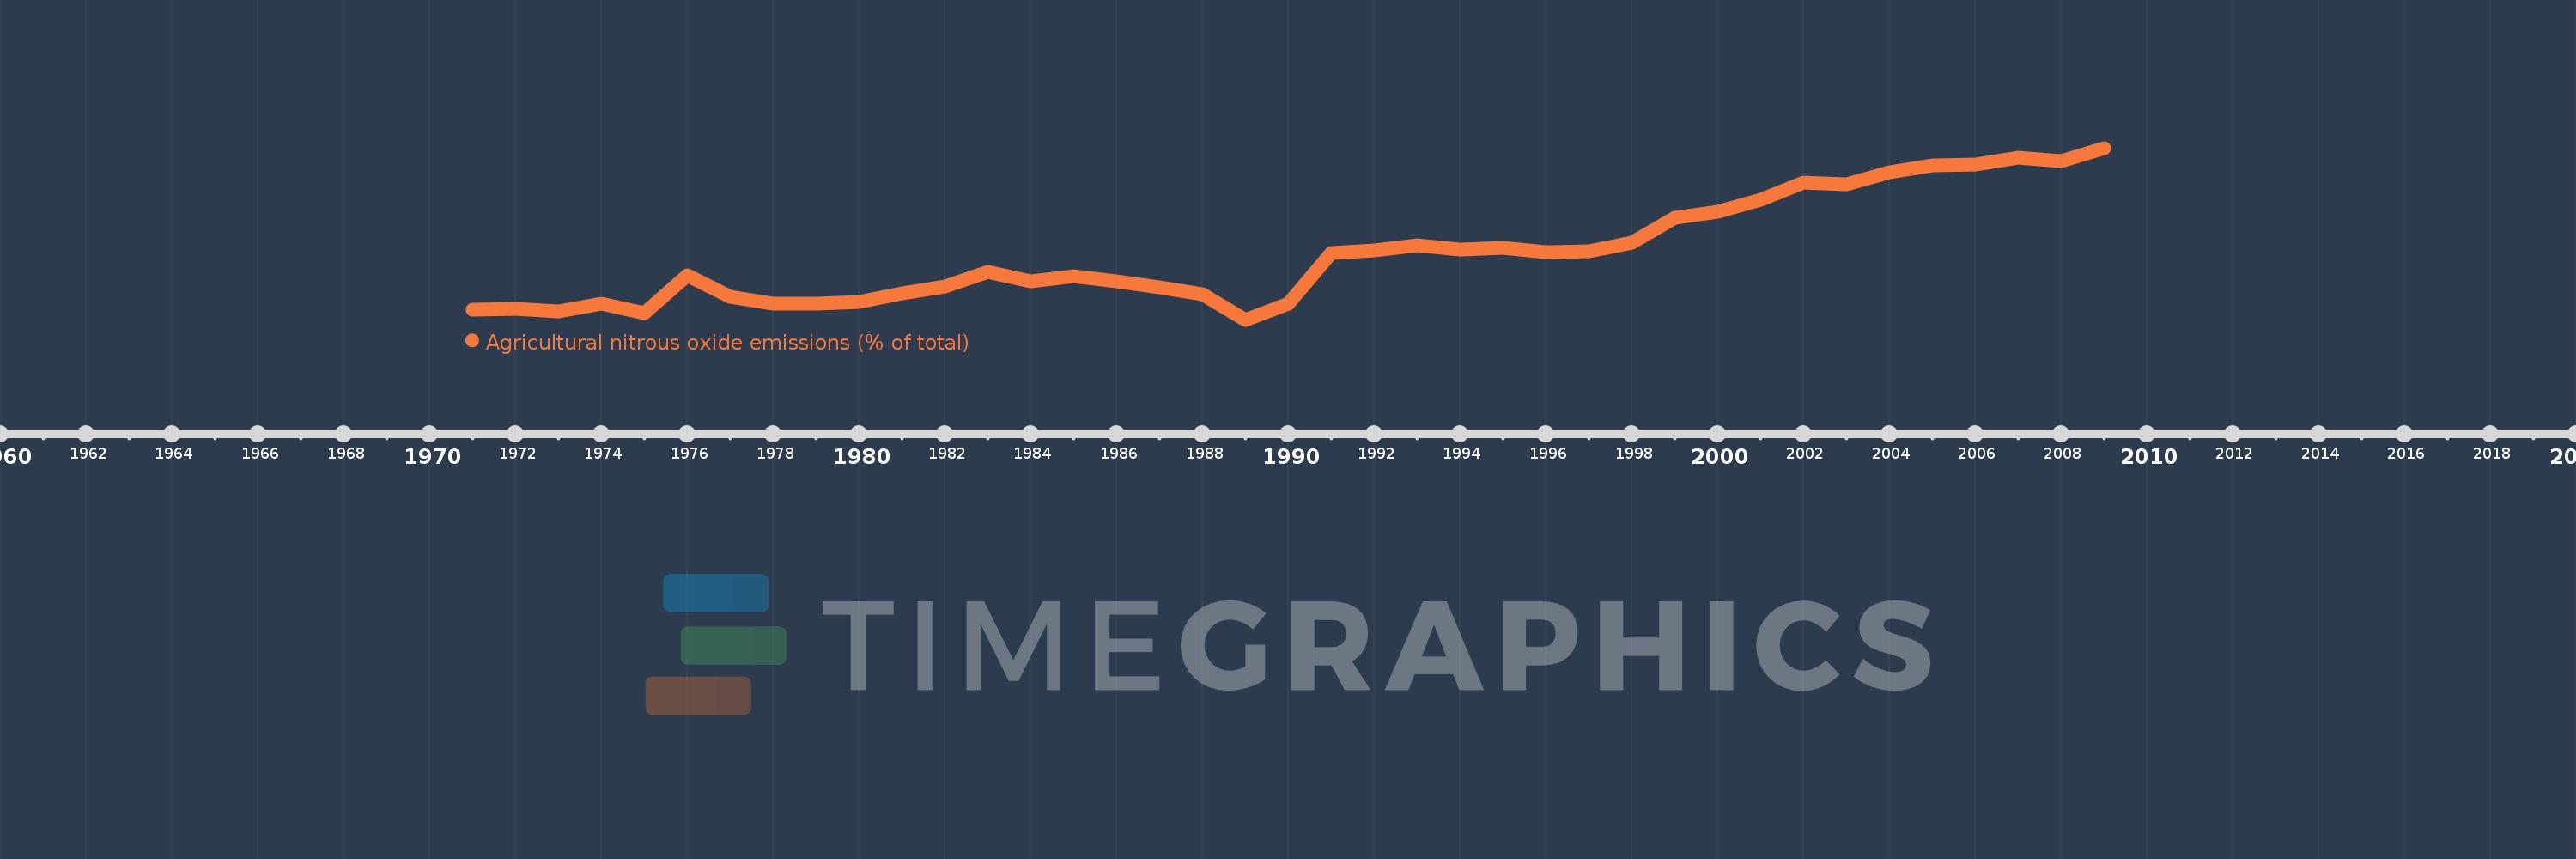
Agricultural nitrous oxide emissions (% of total)
2009,2008,2007,2006,2005,2004,2003,2002,2001,2000,1999,1998,1997,1996,1995,1994,1993,1992,1991,1990,1989,1988,1987,1986,1985,1984,1983,1982,1981,1980,1979,1978,1977,1976,1975,1974,1973,1972,1971
This statistics in other country:
AfghanistanAlbaniaAlgeriaAmerican SamoaAndorraAngolaAntigua and BarbudaArab WorldArgentinaArmeniaArubaAustraliaAustriaAzerbaijanBahamas, TheBahrainBangladeshBarbadosBelarusBelgiumBelizeBeninBermudaBhutanBoliviaBosnia and HerzegovinaBotswanaBrazilBritish Virgin IslandsBrunei DarussalamBulgariaBurkina FasoBurundiCabo VerdeCambodiaCameroonCanadaCaribbean small statesCayman IslandsCentral African RepublicCentral Europe and the BalticsChadChileChinaColombiaComorosCongo, Dem. Rep.Congo, Rep.Costa RicaCote d'IvoireCroatiaCubaCyprusCzech RepublicDenmarkDjiboutiDominicaDominican RepublicEarly-demographic dividendEast Asia & PacificEast Asia & Pacific (excluding high income)East Asia & Pacific (IDA & IBRD countries)EcuadorEgypt, Arab Rep.El SalvadorEquatorial GuineaEritreaEstoniaEthiopiaEuro areaEurope & Central AsiaEurope & Central Asia (excluding high income)Europe & Central Asia (IDA & IBRD countries)European UnionFaroe IslandsFijiFinlandFragile and conflict affected situationsFranceFrench PolynesiaGabonGambia, TheGeorgiaGermanyGhanaGibraltarGreeceGreenlandGrenadaGuamGuatemalaGuineaGuinea-BissauGuyanaHaitiHeavily indebted poor countries (HIPC)High incomeHondurasHong Kong SAR, ChinaHungaryIBRD onlyIcelandIDA & IBRD totalIDA blendIDA onlyIDA totalIndiaIndonesiaIran, Islamic Rep.IraqIrelandIsraelItalyJamaicaJapanJordanKazakhstanKenyaKiribatiKorea, Dem. People’s Rep.Korea, Rep.KuwaitKyrgyz RepublicLao PDRLate-demographic dividendLatin America & Caribbean Latin America & Caribbean (excluding high income)Latin America & the Caribbean (IDA & IBRD countries)LatviaLeast developed countries: UN classificationLebanonLesothoLiberiaLibyaLithuaniaLow & middle incomeLow incomeLower middle incomeLuxembourgMacao SAR, ChinaMacedonia, FYRMadagascarMalawiMalaysiaMaldivesMaliMaltaMarshall IslandsMauritaniaMauritiusMexicoMicronesia, Fed. Sts.Middle East & North AfricaMiddle East & North Africa (excluding high income)Middle East & North Africa (IDA & IBRD countries)Middle incomeMoldovaMongoliaMoroccoMozambiqueMyanmarNamibiaNauruNepalNetherlandsNew CaledoniaNew ZealandNicaraguaNigerNigeriaNorth AmericaNorthern Mariana IslandsNorwayOECD membersOmanOther small statesPacific island small statesPakistanPalauPanamaPapua New GuineaParaguayPeruPhilippinesPolandPortugalPost-demographic dividendPre-demographic dividendPuerto RicoQatarRomaniaRussian FederationRwandaSamoaSao Tome and PrincipeSaudi ArabiaSenegalSerbiaSeychellesSierra LeoneSingaporeSlovak RepublicSloveniaSmall statesSolomon IslandsSomaliaSouth AfricaSouth AsiaSouth Asia (IDA & IBRD)SpainSri LankaSt. Kitts and NevisSt. LuciaSt. Vincent and the GrenadinesSub-Saharan Africa Sub-Saharan Africa (excluding high income)Sub-Saharan Africa (IDA & IBRD countries)SudanSurinameSwazilandSwedenSwitzerlandSyrian Arab RepublicTajikistanTanzaniaThailandTimor-LesteTogoTongaTrinidad and TobagoTunisiaTurkeyTurkmenistanTurks and Caicos IslandsTuvaluUgandaUkraineUnited Arab EmiratesUnited KingdomUnited StatesUpper middle incomeUruguayUzbekistanVanuatuVenezuela, RBVietnamVirgin Islands (U.S.)WorldYemen, Rep.ZambiaZimbabwe Timeline:
This timeline shows a graph from 1971 to 2009 of United States. No data until 1970. Number of actual observations by date: 39.
Source name:
World Development Indicators
Source organization:
World Bank staff estimates from original source: European Commission, Joint Research Centre (JRC)/Netherlands Environmental Assessment Agency (PBL). Emission Database for Global Atmospheric Research (EDGAR): http://edgar.jrc.ec.europa.eu/.
Categories, topics:
Agriculture & Rural Development, Environment
Last updated:
apr 23, 2017
Indicators value changes by year
Maximum:
57.634
jan 1, 2009
At the date of observation
Value
Absolute change
Change from previous value
jan 1, 1971
39.936
+39.936
0.0%
jan 1, 1972
40.017
+0.081
0.2%
jan 1, 1973
39.746
-0.271
-0.68%
jan 1, 1974
40.514
+0.767
1.93%
jan 1, 1975
39.488
-1.026
-2.53%
jan 1, 1976
43.628
+4.14
10.48%
jan 1, 1977
41.306
-2.321
-5.32%
jan 1, 1978
40.565
-0.741
-1.79%
jan 1, 1979
40.598
+0.033
0.08%
jan 1, 1980
40.735
+0.137
0.34%
jan 1, 1981
41.703
+0.968
2.38%
jan 1, 1982
42.448
+0.744
1.78%
jan 1, 1983
44.066
+1.618
3.81%
jan 1, 1984
42.986
-1.08
-2.45%
jan 1, 1985
43.544
+0.558
1.3%
jan 1, 1986
43.001
-0.543
-1.25%
jan 1, 1987
42.309
-0.691
-1.61%
jan 1, 1988
41.577
-0.733
-1.73%
jan 1, 1989
38.79
-2.787
-6.7%
jan 1, 1990
40.538
+1.748
4.51%
jan 1, 1991
46.127
+5.589
13.79%
jan 1, 1992
46.434
+0.306
0.66%
jan 1, 1993
46.932
+0.498
1.07%
jan 1, 1994
46.468
-0.464
-0.99%
jan 1, 1995
46.699
+0.23
0.5%
jan 1, 1996
46.237
-0.462
-0.99%
jan 1, 1997
46.264
+0.027
0.06%
jan 1, 1998
47.248
+0.985
2.13%
jan 1, 1999
49.938
+2.689
5.69%
jan 1, 2000
50.64
+0.703
1.41%
jan 1, 2001
51.934
+1.294
2.55%
jan 1, 2002
53.831
+1.897
3.65%
jan 1, 2003
53.625
-0.205
-0.38%
jan 1, 2004
54.945
+1.32
2.46%
jan 1, 2005
55.675
+0.73
1.33%
jan 1, 2006
55.861
+0.186
0.33%
jan 1, 2007
56.574
+0.713
1.28%
jan 1, 2008
56.167
-0.407
-0.72%
jan 1, 2009
57.634
+1.466
2.61%
Ranking of countries by current statistics by years


Comments: