29
/
en
AIzaSyAYiBZKx7MnpbEhh9jyipgxe19OcubqV5w
April 1, 2024
177317
Lesotho
LSO
true
2
1
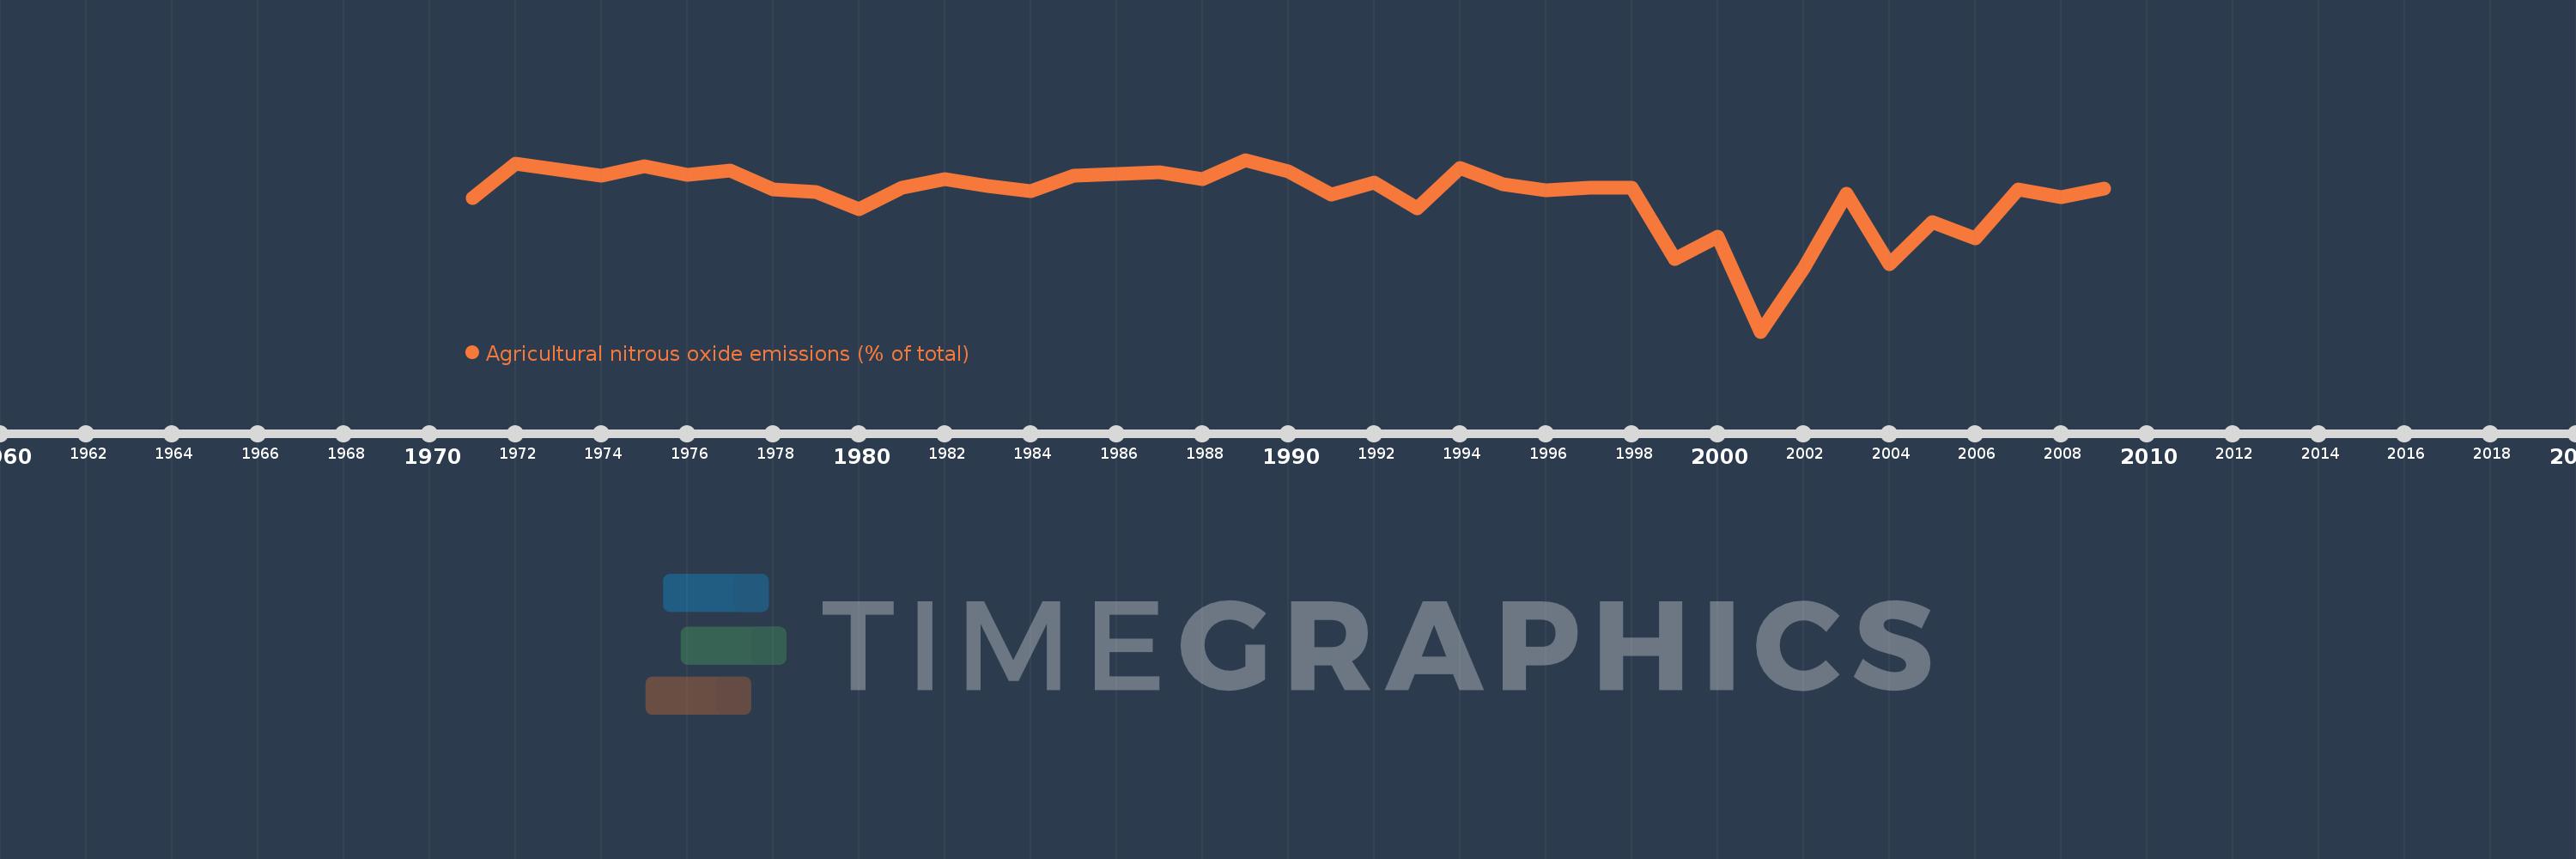
Agricultural nitrous oxide emissions (% of total)
2009,2008,2007,2006,2005,2004,2003,2002,2001,2000,1999,1998,1997,1996,1995,1994,1993,1992,1991,1990,1989,1988,1987,1986,1985,1984,1983,1982,1981,1980,1979,1978,1977,1976,1975,1974,1973,1972,1971
This statistics in other country:
AfghanistanAlbaniaAlgeriaAmerican SamoaAndorraAngolaAntigua and BarbudaArab WorldArgentinaArmeniaArubaAustraliaAustriaAzerbaijanBahamas, TheBahrainBangladeshBarbadosBelarusBelgiumBelizeBeninBermudaBhutanBoliviaBosnia and HerzegovinaBotswanaBrazilBritish Virgin IslandsBrunei DarussalamBulgariaBurkina FasoBurundiCabo VerdeCambodiaCameroonCanadaCaribbean small statesCayman IslandsCentral African RepublicCentral Europe and the BalticsChadChileChinaColombiaComorosCongo, Dem. Rep.Congo, Rep.Costa RicaCote d'IvoireCroatiaCubaCyprusCzech RepublicDenmarkDjiboutiDominicaDominican RepublicEarly-demographic dividendEast Asia & PacificEast Asia & Pacific (excluding high income)East Asia & Pacific (IDA & IBRD countries)EcuadorEgypt, Arab Rep.El SalvadorEquatorial GuineaEritreaEstoniaEthiopiaEuro areaEurope & Central AsiaEurope & Central Asia (excluding high income)Europe & Central Asia (IDA & IBRD countries)European UnionFaroe IslandsFijiFinlandFragile and conflict affected situationsFranceFrench PolynesiaGabonGambia, TheGeorgiaGermanyGhanaGibraltarGreeceGreenlandGrenadaGuamGuatemalaGuineaGuinea-BissauGuyanaHaitiHeavily indebted poor countries (HIPC)High incomeHondurasHong Kong SAR, ChinaHungaryIBRD onlyIcelandIDA & IBRD totalIDA blendIDA onlyIDA totalIndiaIndonesiaIran, Islamic Rep.IraqIrelandIsraelItalyJamaicaJapanJordanKazakhstanKenyaKiribatiKorea, Dem. People’s Rep.Korea, Rep.KuwaitKyrgyz RepublicLao PDRLate-demographic dividendLatin America & Caribbean Latin America & Caribbean (excluding high income)Latin America & the Caribbean (IDA & IBRD countries)LatviaLeast developed countries: UN classificationLebanonLesothoLiberiaLibyaLithuaniaLow & middle incomeLow incomeLower middle incomeLuxembourgMacao SAR, ChinaMacedonia, FYRMadagascarMalawiMalaysiaMaldivesMaliMaltaMarshall IslandsMauritaniaMauritiusMexicoMicronesia, Fed. Sts.Middle East & North AfricaMiddle East & North Africa (excluding high income)Middle East & North Africa (IDA & IBRD countries)Middle incomeMoldovaMongoliaMoroccoMozambiqueMyanmarNamibiaNauruNepalNetherlandsNew CaledoniaNew ZealandNicaraguaNigerNigeriaNorth AmericaNorthern Mariana IslandsNorwayOECD membersOmanOther small statesPacific island small statesPakistanPalauPanamaPapua New GuineaParaguayPeruPhilippinesPolandPortugalPost-demographic dividendPre-demographic dividendPuerto RicoQatarRomaniaRussian FederationRwandaSamoaSao Tome and PrincipeSaudi ArabiaSenegalSerbiaSeychellesSierra LeoneSingaporeSlovak RepublicSloveniaSmall statesSolomon IslandsSomaliaSouth AfricaSouth AsiaSouth Asia (IDA & IBRD)SpainSri LankaSt. Kitts and NevisSt. LuciaSt. Vincent and the GrenadinesSub-Saharan Africa Sub-Saharan Africa (excluding high income)Sub-Saharan Africa (IDA & IBRD countries)SudanSurinameSwazilandSwedenSwitzerlandSyrian Arab RepublicTajikistanTanzaniaThailandTimor-LesteTogoTongaTrinidad and TobagoTunisiaTurkeyTurkmenistanTurks and Caicos IslandsTuvaluUgandaUkraineUnited Arab EmiratesUnited KingdomUnited StatesUpper middle incomeUruguayUzbekistanVanuatuVenezuela, RBVietnamVirgin Islands (U.S.)WorldYemen, Rep.ZambiaZimbabwe Timeline:
This timeline shows a graph from 1971 to 2009 of Lesotho. No data until 1970. Number of actual observations by date: 39.
Source name:
World Development Indicators
Source organization:
World Bank staff estimates from original source: European Commission, Joint Research Centre (JRC)/Netherlands Environmental Assessment Agency (PBL). Emission Database for Global Atmospheric Research (EDGAR): http://edgar.jrc.ec.europa.eu/.
Categories, topics:
Agriculture & Rural Development, Environment
Last updated:
apr 23, 2017
Indicators value changes by year
Minimum:
56.753
jan 1, 2001
Maximum:
86.561
jan 1, 1989
At the date of observation
Value
Absolute change
Change from previous value
jan 1, 1971
79.917
+79.917
0.0%
jan 1, 1972
85.875
+5.958
7.46%
jan 1, 1973
84.817
-1.058
-1.23%
jan 1, 1974
83.862
-0.955
-1.13%
jan 1, 1975
85.494
+1.632
1.95%
jan 1, 1976
83.991
-1.503
-1.76%
jan 1, 1977
84.725
+0.734
0.87%
jan 1, 1978
81.468
-3.257
-3.84%
jan 1, 1979
80.969
-0.499
-0.61%
jan 1, 1980
78.046
-2.923
-3.61%
jan 1, 1981
81.644
+3.598
4.61%
jan 1, 1982
83.142
+1.498
1.84%
jan 1, 1983
82.043
-1.099
-1.32%
jan 1, 1984
81.057
-0.986
-1.2%
jan 1, 1985
83.826
+2.769
3.42%
jan 1, 1986
84.05
+0.225
0.27%
jan 1, 1987
84.446
+0.396
0.47%
jan 1, 1988
83.155
-1.291
-1.53%
jan 1, 1989
86.561
+3.405
4.1%
jan 1, 1990
84.578
-1.983
-2.29%
jan 1, 1991
80.52
-4.057
-4.8%
jan 1, 1992
82.639
+2.118
2.63%
jan 1, 1993
78.142
-4.497
-5.44%
jan 1, 1994
85.163
+7.02
8.98%
jan 1, 1995
82.329
-2.833
-3.33%
jan 1, 1996
81.234
-1.096
-1.33%
jan 1, 1997
81.771
+0.537
0.66%
jan 1, 1998
81.777
+0.006
0.01%
jan 1, 1999
69.317
-12.46
-15.24%
jan 1, 2000
73.229
+3.912
5.64%
jan 1, 2001
56.753
-16.476
-22.5%
jan 1, 2002
67.634
+10.881
19.17%
jan 1, 2003
80.626
+12.992
19.21%
jan 1, 2004
68.4
-12.226
-15.16%
jan 1, 2005
75.72
+7.321
10.7%
jan 1, 2006
72.956
-2.765
-3.65%
jan 1, 2007
81.476
+8.521
11.68%
jan 1, 2008
80.02
-1.457
-1.79%
jan 1, 2009
81.545
+1.525
1.91%
Ranking of countries by current statistics by years


Comments: