29
/
en
AIzaSyAYiBZKx7MnpbEhh9jyipgxe19OcubqV5w
April 1, 2024
109299
Congo, Dem. Rep.
COD
true
2
1
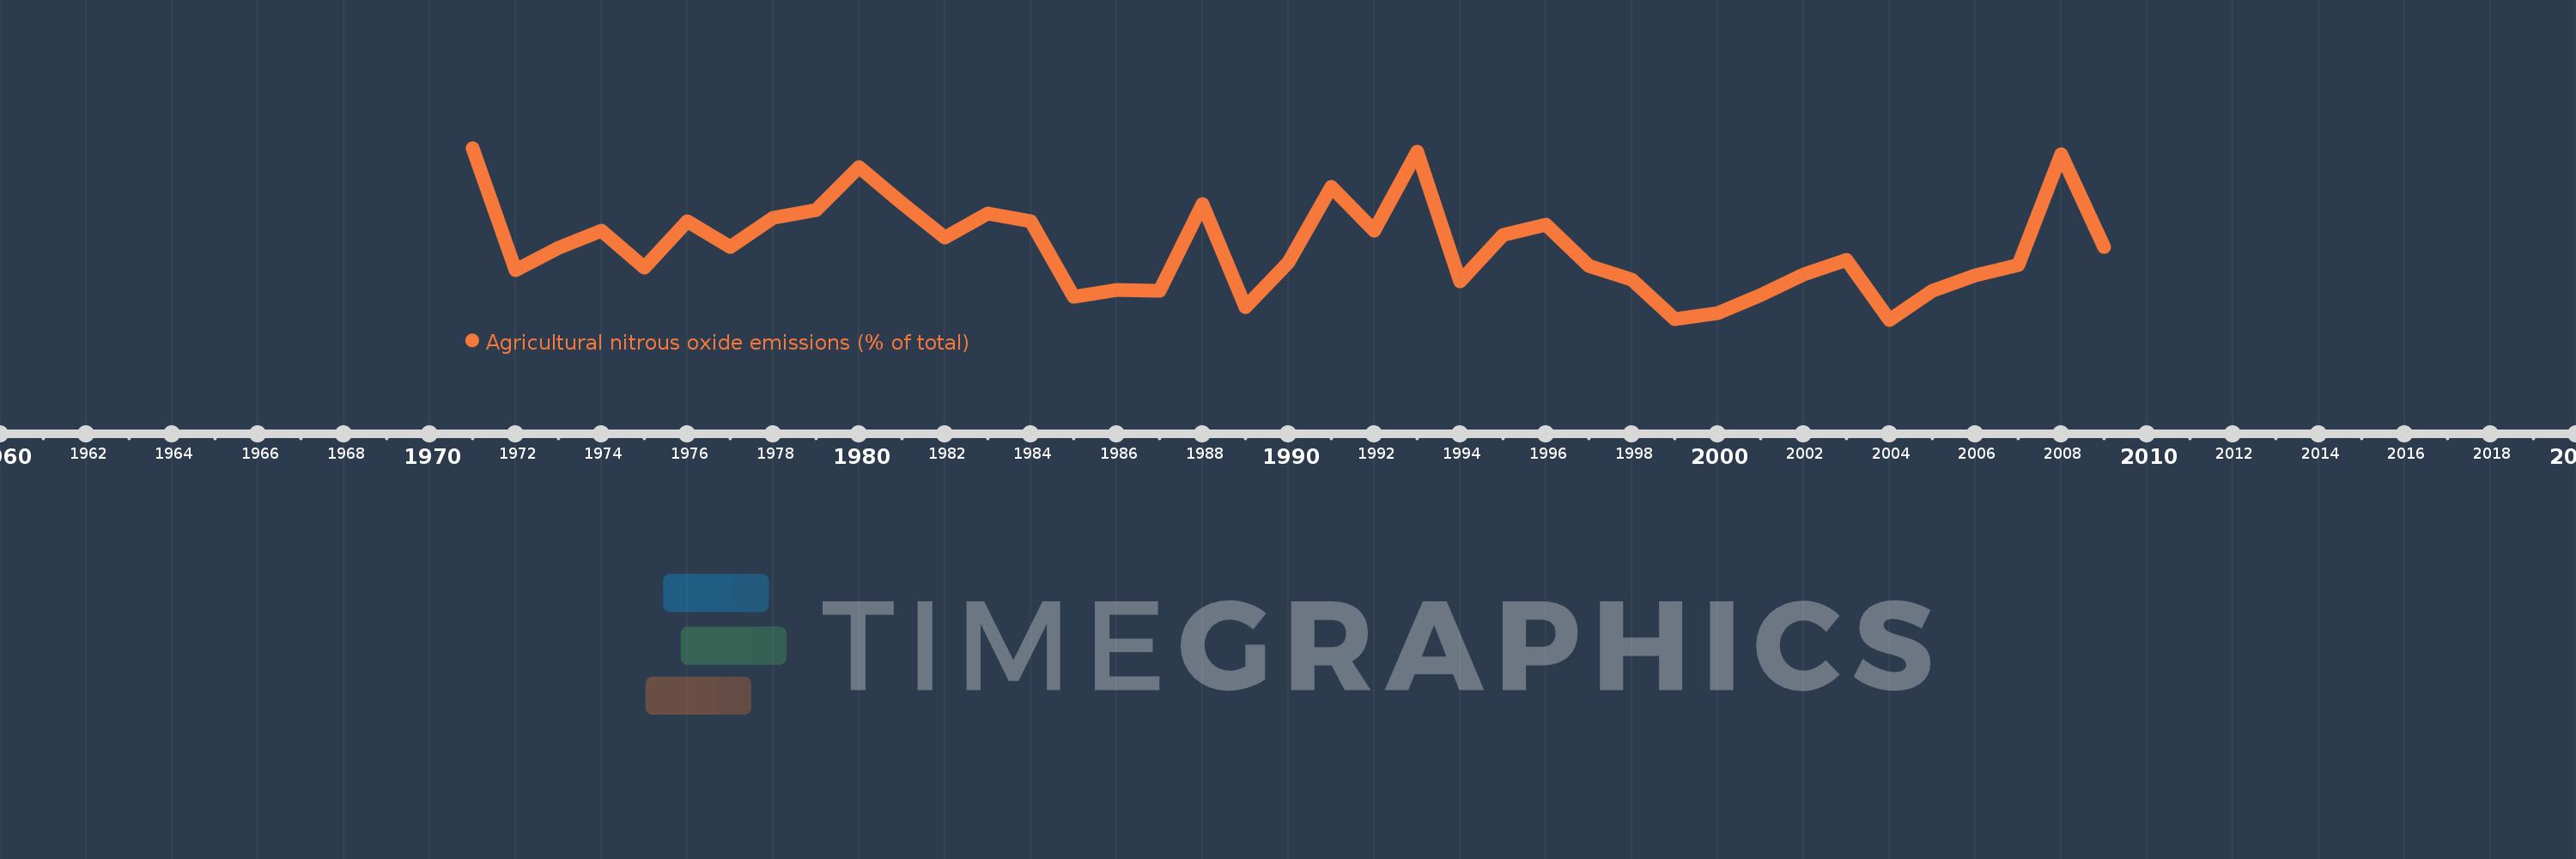
Agricultural nitrous oxide emissions (% of total)
2009,2008,2007,2006,2005,2004,2003,2002,2001,2000,1999,1998,1997,1996,1995,1994,1993,1992,1991,1990,1989,1988,1987,1986,1985,1984,1983,1982,1981,1980,1979,1978,1977,1976,1975,1974,1973,1972,1971
This statistics in other country:
AfghanistanAlbaniaAlgeriaAmerican SamoaAndorraAngolaAntigua and BarbudaArab WorldArgentinaArmeniaArubaAustraliaAustriaAzerbaijanBahamas, TheBahrainBangladeshBarbadosBelarusBelgiumBelizeBeninBermudaBhutanBoliviaBosnia and HerzegovinaBotswanaBrazilBritish Virgin IslandsBrunei DarussalamBulgariaBurkina FasoBurundiCabo VerdeCambodiaCameroonCanadaCaribbean small statesCayman IslandsCentral African RepublicCentral Europe and the BalticsChadChileChinaColombiaComorosCongo, Dem. Rep.Congo, Rep.Costa RicaCote d'IvoireCroatiaCubaCyprusCzech RepublicDenmarkDjiboutiDominicaDominican RepublicEarly-demographic dividendEast Asia & PacificEast Asia & Pacific (excluding high income)East Asia & Pacific (IDA & IBRD countries)EcuadorEgypt, Arab Rep.El SalvadorEquatorial GuineaEritreaEstoniaEthiopiaEuro areaEurope & Central AsiaEurope & Central Asia (excluding high income)Europe & Central Asia (IDA & IBRD countries)European UnionFaroe IslandsFijiFinlandFragile and conflict affected situationsFranceFrench PolynesiaGabonGambia, TheGeorgiaGermanyGhanaGibraltarGreeceGreenlandGrenadaGuamGuatemalaGuineaGuinea-BissauGuyanaHaitiHeavily indebted poor countries (HIPC)High incomeHondurasHong Kong SAR, ChinaHungaryIBRD onlyIcelandIDA & IBRD totalIDA blendIDA onlyIDA totalIndiaIndonesiaIran, Islamic Rep.IraqIrelandIsraelItalyJamaicaJapanJordanKazakhstanKenyaKiribatiKorea, Dem. People’s Rep.Korea, Rep.KuwaitKyrgyz RepublicLao PDRLate-demographic dividendLatin America & Caribbean Latin America & Caribbean (excluding high income)Latin America & the Caribbean (IDA & IBRD countries)LatviaLeast developed countries: UN classificationLebanonLesothoLiberiaLibyaLithuaniaLow & middle incomeLow incomeLower middle incomeLuxembourgMacao SAR, ChinaMacedonia, FYRMadagascarMalawiMalaysiaMaldivesMaliMaltaMarshall IslandsMauritaniaMauritiusMexicoMicronesia, Fed. Sts.Middle East & North AfricaMiddle East & North Africa (excluding high income)Middle East & North Africa (IDA & IBRD countries)Middle incomeMoldovaMongoliaMoroccoMozambiqueMyanmarNamibiaNauruNepalNetherlandsNew CaledoniaNew ZealandNicaraguaNigerNigeriaNorth AmericaNorthern Mariana IslandsNorwayOECD membersOmanOther small statesPacific island small statesPakistanPalauPanamaPapua New GuineaParaguayPeruPhilippinesPolandPortugalPost-demographic dividendPre-demographic dividendPuerto RicoQatarRomaniaRussian FederationRwandaSamoaSao Tome and PrincipeSaudi ArabiaSenegalSerbiaSeychellesSierra LeoneSingaporeSlovak RepublicSloveniaSmall statesSolomon IslandsSomaliaSouth AfricaSouth AsiaSouth Asia (IDA & IBRD)SpainSri LankaSt. Kitts and NevisSt. LuciaSt. Vincent and the GrenadinesSub-Saharan Africa Sub-Saharan Africa (excluding high income)Sub-Saharan Africa (IDA & IBRD countries)SudanSurinameSwazilandSwedenSwitzerlandSyrian Arab RepublicTajikistanTanzaniaThailandTimor-LesteTogoTongaTrinidad and TobagoTunisiaTurkeyTurkmenistanTurks and Caicos IslandsTuvaluUgandaUkraineUnited Arab EmiratesUnited KingdomUnited StatesUpper middle incomeUruguayUzbekistanVanuatuVenezuela, RBVietnamVirgin Islands (U.S.)WorldYemen, Rep.ZambiaZimbabwe Timeline:
This timeline shows a graph from 1971 to 2009 of Congo, Dem. Rep.. No data until 1970. Number of actual observations by date: 39.
Source name:
World Development Indicators
Source organization:
World Bank staff estimates from original source: European Commission, Joint Research Centre (JRC)/Netherlands Environmental Assessment Agency (PBL). Emission Database for Global Atmospheric Research (EDGAR): http://edgar.jrc.ec.europa.eu/.
Categories, topics:
Agriculture & Rural Development, Environment
Last updated:
apr 23, 2017
Indicators value changes by year
Minimum:
26.693
jan 1, 2004
Maximum:
38.776
jan 1, 1971
At the date of observation
Value
Absolute change
Change from previous value
jan 1, 1971
38.776
+38.776
0.0%
jan 1, 1972
30.164
-8.612
-22.21%
jan 1, 1973
31.734
+1.571
5.21%
jan 1, 1974
32.986
+1.252
3.94%
jan 1, 1975
30.353
-2.633
-7.98%
jan 1, 1976
33.634
+3.281
10.81%
jan 1, 1977
31.793
-1.841
-5.47%
jan 1, 1978
33.879
+2.086
6.56%
jan 1, 1979
34.379
+0.499
1.47%
jan 1, 1980
37.441
+3.062
8.91%
jan 1, 1981
34.873
-2.568
-6.86%
jan 1, 1982
32.48
-2.393
-6.86%
jan 1, 1983
34.18
+1.701
5.24%
jan 1, 1984
33.61
-0.571
-1.67%
jan 1, 1985
28.289
-5.32
-15.83%
jan 1, 1986
28.795
+0.506
1.79%
jan 1, 1987
28.746
-0.049
-0.17%
jan 1, 1988
34.81
+6.064
21.1%
jan 1, 1989
27.589
-7.222
-20.75%
jan 1, 1990
30.701
+3.113
11.28%
jan 1, 1991
36.057
+5.356
17.45%
jan 1, 1992
32.95
-3.108
-8.62%
jan 1, 1993
38.517
+5.567
16.9%
jan 1, 1994
29.38
-9.138
-23.72%
jan 1, 1995
32.667
+3.287
11.19%
jan 1, 1996
33.375
+0.708
2.17%
jan 1, 1997
30.496
-2.878
-8.62%
jan 1, 1998
29.495
-1.001
-3.28%
jan 1, 1999
26.726
-2.769
-9.39%
jan 1, 2000
27.138
+0.411
1.54%
jan 1, 2001
28.426
+1.288
4.75%
jan 1, 2002
29.855
+1.429
5.03%
jan 1, 2003
30.895
+1.04
3.48%
jan 1, 2004
26.693
-4.202
-13.6%
jan 1, 2005
28.707
+2.014
7.55%
jan 1, 2006
29.789
+1.082
3.77%
jan 1, 2007
30.549
+0.76
2.55%
jan 1, 2008
38.322
+7.773
25.44%
jan 1, 2009
31.837
-6.485
-16.92%
Ranking of countries by current statistics by years


Comments: