29
/
en
AIzaSyAYiBZKx7MnpbEhh9jyipgxe19OcubqV5w
April 1, 2024
56029
Small states
SST
false
2
1
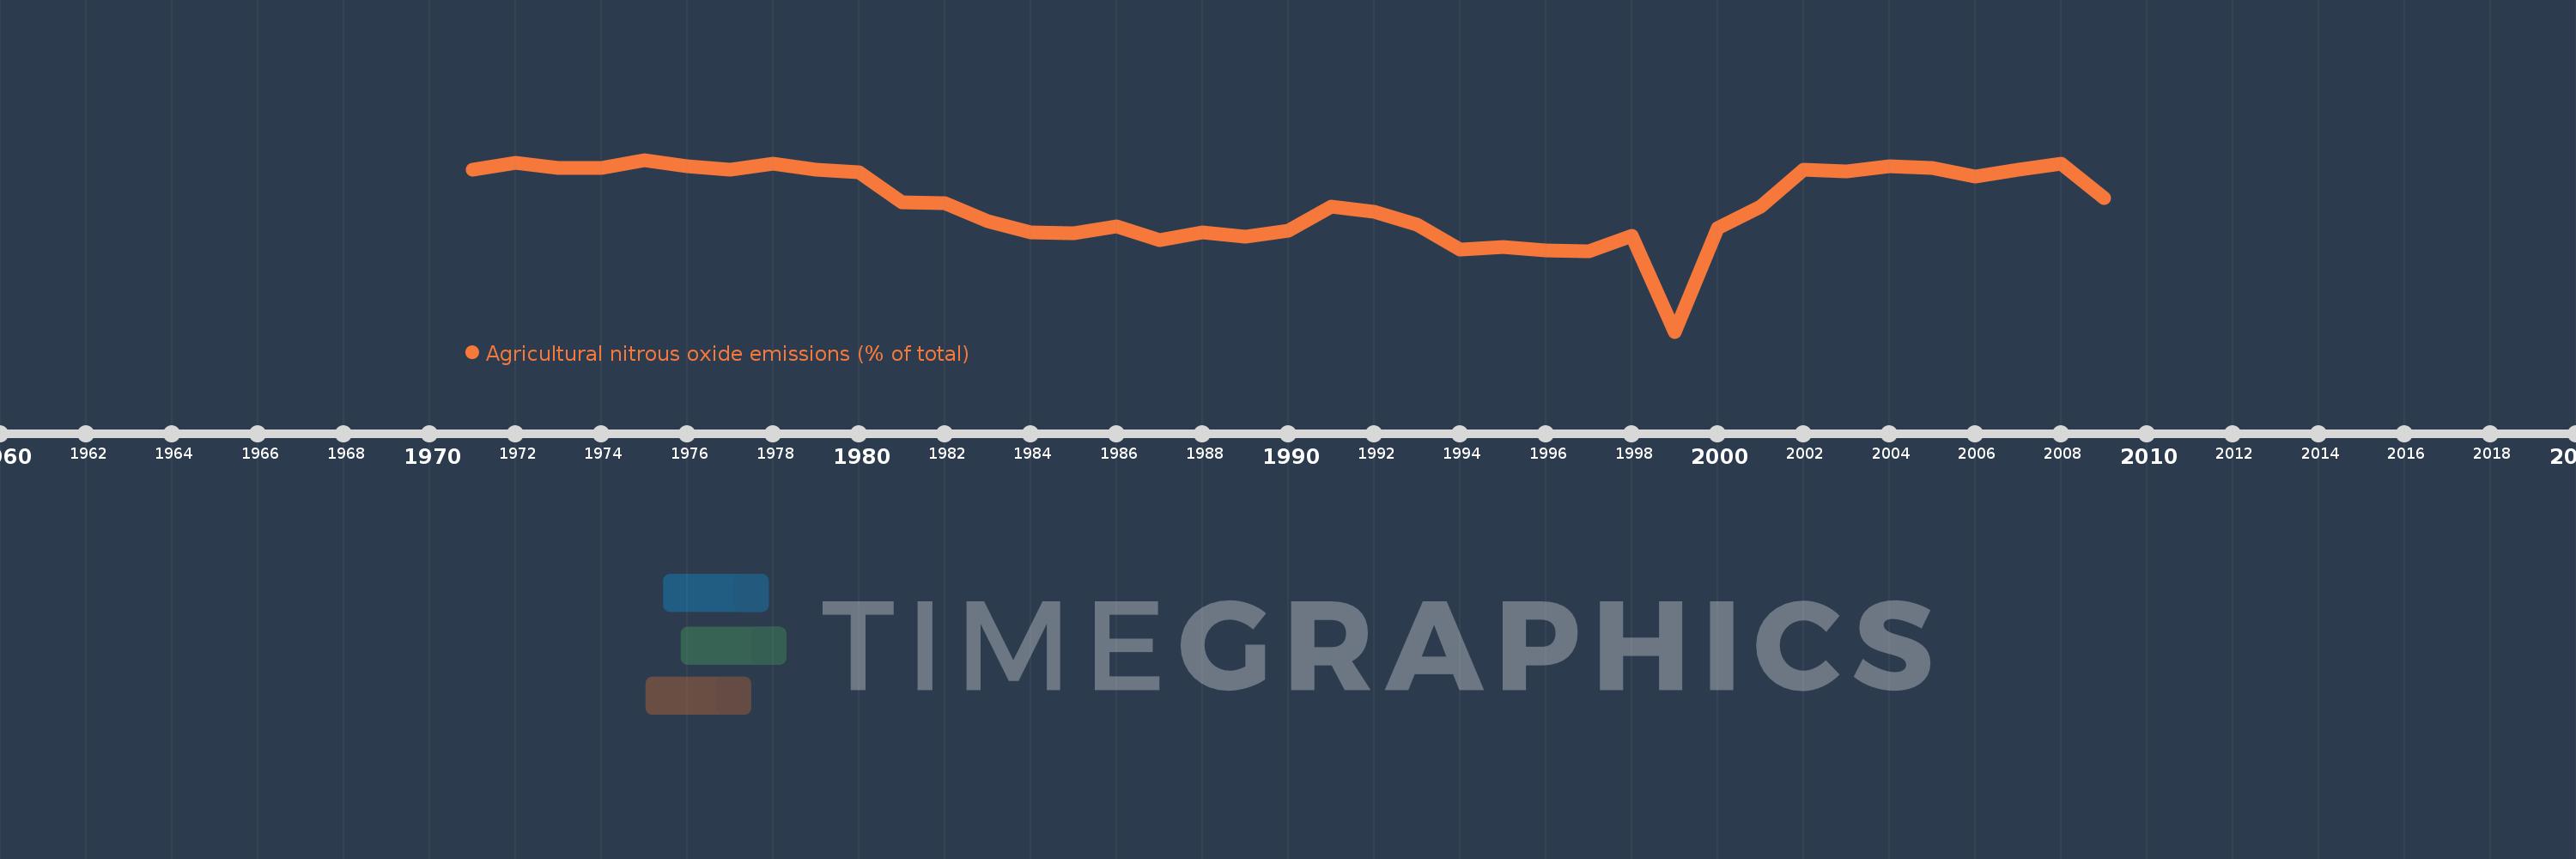
Agricultural nitrous oxide emissions (% of total)
2009,2008,2007,2006,2005,2004,2003,2002,2001,2000,1999,1998,1997,1996,1995,1994,1993,1992,1991,1990,1989,1988,1987,1986,1985,1984,1983,1982,1981,1980,1979,1978,1977,1976,1975,1974,1973,1972,1971
This statistics in other country:
AfghanistanAlbaniaAlgeriaAmerican SamoaAndorraAngolaAntigua and BarbudaArab WorldArgentinaArmeniaArubaAustraliaAustriaAzerbaijanBahamas, TheBahrainBangladeshBarbadosBelarusBelgiumBelizeBeninBermudaBhutanBoliviaBosnia and HerzegovinaBotswanaBrazilBritish Virgin IslandsBrunei DarussalamBulgariaBurkina FasoBurundiCabo VerdeCambodiaCameroonCanadaCaribbean small statesCayman IslandsCentral African RepublicCentral Europe and the BalticsChadChileChinaColombiaComorosCongo, Dem. Rep.Congo, Rep.Costa RicaCote d'IvoireCroatiaCubaCyprusCzech RepublicDenmarkDjiboutiDominicaDominican RepublicEarly-demographic dividendEast Asia & PacificEast Asia & Pacific (excluding high income)East Asia & Pacific (IDA & IBRD countries)EcuadorEgypt, Arab Rep.El SalvadorEquatorial GuineaEritreaEstoniaEthiopiaEuro areaEurope & Central AsiaEurope & Central Asia (excluding high income)Europe & Central Asia (IDA & IBRD countries)European UnionFaroe IslandsFijiFinlandFragile and conflict affected situationsFranceFrench PolynesiaGabonGambia, TheGeorgiaGermanyGhanaGibraltarGreeceGreenlandGrenadaGuamGuatemalaGuineaGuinea-BissauGuyanaHaitiHeavily indebted poor countries (HIPC)High incomeHondurasHong Kong SAR, ChinaHungaryIBRD onlyIcelandIDA & IBRD totalIDA blendIDA onlyIDA totalIndiaIndonesiaIran, Islamic Rep.IraqIrelandIsraelItalyJamaicaJapanJordanKazakhstanKenyaKiribatiKorea, Dem. People’s Rep.Korea, Rep.KuwaitKyrgyz RepublicLao PDRLate-demographic dividendLatin America & Caribbean Latin America & Caribbean (excluding high income)Latin America & the Caribbean (IDA & IBRD countries)LatviaLeast developed countries: UN classificationLebanonLesothoLiberiaLibyaLithuaniaLow & middle incomeLow incomeLower middle incomeLuxembourgMacao SAR, ChinaMacedonia, FYRMadagascarMalawiMalaysiaMaldivesMaliMaltaMarshall IslandsMauritaniaMauritiusMexicoMicronesia, Fed. Sts.Middle East & North AfricaMiddle East & North Africa (excluding high income)Middle East & North Africa (IDA & IBRD countries)Middle incomeMoldovaMongoliaMoroccoMozambiqueMyanmarNamibiaNauruNepalNetherlandsNew CaledoniaNew ZealandNicaraguaNigerNigeriaNorth AmericaNorthern Mariana IslandsNorwayOECD membersOmanOther small statesPacific island small statesPakistanPalauPanamaPapua New GuineaParaguayPeruPhilippinesPolandPortugalPost-demographic dividendPre-demographic dividendPuerto RicoQatarRomaniaRussian FederationRwandaSamoaSao Tome and PrincipeSaudi ArabiaSenegalSerbiaSeychellesSierra LeoneSingaporeSlovak RepublicSloveniaSmall statesSolomon IslandsSomaliaSouth AfricaSouth AsiaSouth Asia (IDA & IBRD)SpainSri LankaSt. Kitts and NevisSt. LuciaSt. Vincent and the GrenadinesSub-Saharan Africa Sub-Saharan Africa (excluding high income)Sub-Saharan Africa (IDA & IBRD countries)SudanSurinameSwazilandSwedenSwitzerlandSyrian Arab RepublicTajikistanTanzaniaThailandTimor-LesteTogoTongaTrinidad and TobagoTunisiaTurkeyTurkmenistanTurks and Caicos IslandsTuvaluUgandaUkraineUnited Arab EmiratesUnited KingdomUnited StatesUpper middle incomeUruguayUzbekistanVanuatuVenezuela, RBVietnamVirgin Islands (U.S.)WorldYemen, Rep.ZambiaZimbabwe Timeline:
This timeline shows a graph from 1971 to 2009 of Small states. No data until 1970. Number of actual observations by date: 39.
Source name:
World Development Indicators
Source organization:
World Bank staff estimates from original source: European Commission, Joint Research Centre (JRC)/Netherlands Environmental Assessment Agency (PBL). Emission Database for Global Atmospheric Research (EDGAR): http://edgar.jrc.ec.europa.eu/.
Categories, topics:
Agriculture & Rural Development, Environment
Last updated:
apr 23, 2017
Indicators value changes by year
Minimum:
61.514
jan 1, 1999
Maximum:
80.762
jan 1, 1975
At the date of observation
Value
Absolute change
Change from previous value
jan 1, 1971
79.703
+79.703
0.0%
jan 1, 1972
80.45
+0.748
0.94%
jan 1, 1973
79.865
-0.585
-0.73%
jan 1, 1974
79.886
+0.02
0.03%
jan 1, 1975
80.762
+0.877
1.1%
jan 1, 1976
80.063
-0.699
-0.87%
jan 1, 1977
79.658
-0.405
-0.51%
jan 1, 1978
80.291
+0.633
0.79%
jan 1, 1979
79.637
-0.654
-0.81%
jan 1, 1980
79.327
-0.31
-0.39%
jan 1, 1981
76.011
-3.316
-4.18%
jan 1, 1982
75.944
-0.068
-0.09%
jan 1, 1983
73.927
-2.017
-2.66%
jan 1, 1984
72.616
-1.311
-1.77%
jan 1, 1985
72.559
-0.057
-0.08%
jan 1, 1986
73.316
+0.757
1.04%
jan 1, 1987
71.764
-1.552
-2.12%
jan 1, 1988
72.67
+0.906
1.26%
jan 1, 1989
72.19
-0.48
-0.66%
jan 1, 1990
72.849
+0.658
0.91%
jan 1, 1991
75.491
+2.642
3.63%
jan 1, 1992
74.896
-0.595
-0.79%
jan 1, 1993
73.526
-1.37
-1.83%
jan 1, 1994
70.722
-2.804
-3.81%
jan 1, 1995
70.951
+0.229
0.32%
jan 1, 1996
70.586
-0.365
-0.51%
jan 1, 1997
70.53
-0.056
-0.08%
jan 1, 1998
72.247
+1.717
2.44%
jan 1, 1999
61.514
-10.733
-14.86%
jan 1, 2000
73.127
+11.613
18.88%
jan 1, 2001
75.489
+2.363
3.23%
jan 1, 2002
79.695
+4.206
5.57%
jan 1, 2003
79.457
-0.238
-0.3%
jan 1, 2004
80.063
+0.606
0.76%
jan 1, 2005
79.833
-0.23
-0.29%
jan 1, 2006
78.904
-0.928
-1.16%
jan 1, 2007
79.664
+0.76
0.96%
jan 1, 2008
80.297
+0.633
0.79%
jan 1, 2009
76.485
-3.812
-4.75%
Ranking of countries by current statistics by years


Comments: