29
/
en
AIzaSyAYiBZKx7MnpbEhh9jyipgxe19OcubqV5w
April 1, 2024
221794
Peru
PER
true
2
1
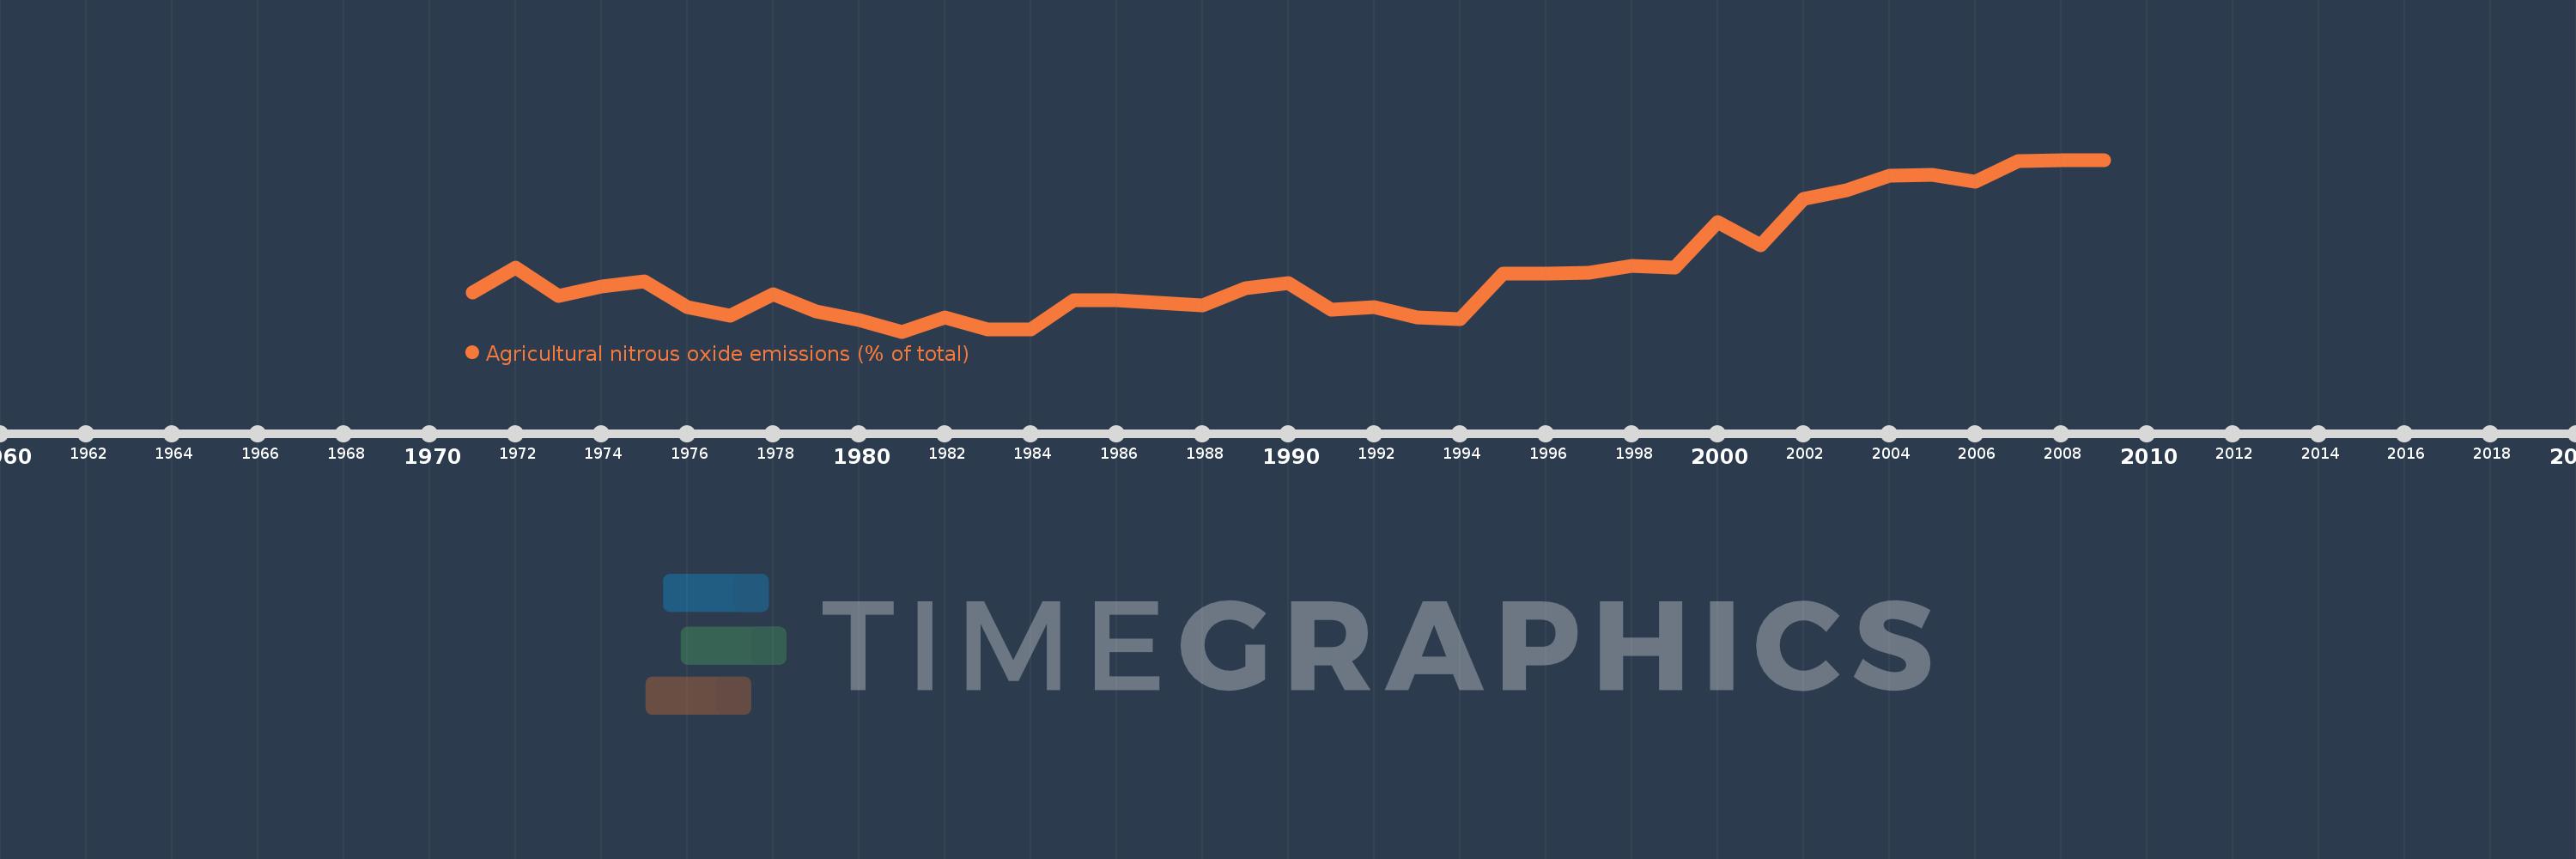
Agricultural nitrous oxide emissions (% of total)
2009,2008,2007,2006,2005,2004,2003,2002,2001,2000,1999,1998,1997,1996,1995,1994,1993,1992,1991,1990,1989,1988,1987,1986,1985,1984,1983,1982,1981,1980,1979,1978,1977,1976,1975,1974,1973,1972,1971
This statistics in other country:
AfghanistanAlbaniaAlgeriaAmerican SamoaAndorraAngolaAntigua and BarbudaArab WorldArgentinaArmeniaArubaAustraliaAustriaAzerbaijanBahamas, TheBahrainBangladeshBarbadosBelarusBelgiumBelizeBeninBermudaBhutanBoliviaBosnia and HerzegovinaBotswanaBrazilBritish Virgin IslandsBrunei DarussalamBulgariaBurkina FasoBurundiCabo VerdeCambodiaCameroonCanadaCaribbean small statesCayman IslandsCentral African RepublicCentral Europe and the BalticsChadChileChinaColombiaComorosCongo, Dem. Rep.Congo, Rep.Costa RicaCote d'IvoireCroatiaCubaCyprusCzech RepublicDenmarkDjiboutiDominicaDominican RepublicEarly-demographic dividendEast Asia & PacificEast Asia & Pacific (excluding high income)East Asia & Pacific (IDA & IBRD countries)EcuadorEgypt, Arab Rep.El SalvadorEquatorial GuineaEritreaEstoniaEthiopiaEuro areaEurope & Central AsiaEurope & Central Asia (excluding high income)Europe & Central Asia (IDA & IBRD countries)European UnionFaroe IslandsFijiFinlandFragile and conflict affected situationsFranceFrench PolynesiaGabonGambia, TheGeorgiaGermanyGhanaGibraltarGreeceGreenlandGrenadaGuamGuatemalaGuineaGuinea-BissauGuyanaHaitiHeavily indebted poor countries (HIPC)High incomeHondurasHong Kong SAR, ChinaHungaryIBRD onlyIcelandIDA & IBRD totalIDA blendIDA onlyIDA totalIndiaIndonesiaIran, Islamic Rep.IraqIrelandIsraelItalyJamaicaJapanJordanKazakhstanKenyaKiribatiKorea, Dem. People’s Rep.Korea, Rep.KuwaitKyrgyz RepublicLao PDRLate-demographic dividendLatin America & Caribbean Latin America & Caribbean (excluding high income)Latin America & the Caribbean (IDA & IBRD countries)LatviaLeast developed countries: UN classificationLebanonLesothoLiberiaLibyaLithuaniaLow & middle incomeLow incomeLower middle incomeLuxembourgMacao SAR, ChinaMacedonia, FYRMadagascarMalawiMalaysiaMaldivesMaliMaltaMarshall IslandsMauritaniaMauritiusMexicoMicronesia, Fed. Sts.Middle East & North AfricaMiddle East & North Africa (excluding high income)Middle East & North Africa (IDA & IBRD countries)Middle incomeMoldovaMongoliaMoroccoMozambiqueMyanmarNamibiaNauruNepalNetherlandsNew CaledoniaNew ZealandNicaraguaNigerNigeriaNorth AmericaNorthern Mariana IslandsNorwayOECD membersOmanOther small statesPacific island small statesPakistanPalauPanamaPapua New GuineaParaguayPeruPhilippinesPolandPortugalPost-demographic dividendPre-demographic dividendPuerto RicoQatarRomaniaRussian FederationRwandaSamoaSao Tome and PrincipeSaudi ArabiaSenegalSerbiaSeychellesSierra LeoneSingaporeSlovak RepublicSloveniaSmall statesSolomon IslandsSomaliaSouth AfricaSouth AsiaSouth Asia (IDA & IBRD)SpainSri LankaSt. Kitts and NevisSt. LuciaSt. Vincent and the GrenadinesSub-Saharan Africa Sub-Saharan Africa (excluding high income)Sub-Saharan Africa (IDA & IBRD countries)SudanSurinameSwazilandSwedenSwitzerlandSyrian Arab RepublicTajikistanTanzaniaThailandTimor-LesteTogoTongaTrinidad and TobagoTunisiaTurkeyTurkmenistanTurks and Caicos IslandsTuvaluUgandaUkraineUnited Arab EmiratesUnited KingdomUnited StatesUpper middle incomeUruguayUzbekistanVanuatuVenezuela, RBVietnamVirgin Islands (U.S.)WorldYemen, Rep.ZambiaZimbabwe Timeline:
This timeline shows a graph from 1971 to 2009 of Peru. No data until 1970. Number of actual observations by date: 39.
Source name:
World Development Indicators
Source organization:
World Bank staff estimates from original source: European Commission, Joint Research Centre (JRC)/Netherlands Environmental Assessment Agency (PBL). Emission Database for Global Atmospheric Research (EDGAR): http://edgar.jrc.ec.europa.eu/.
Categories, topics:
Agriculture & Rural Development, Environment
Last updated:
apr 23, 2017
Indicators value changes by year
Maximum:
84.558
jan 1, 2009
At the date of observation
Value
Absolute change
Change from previous value
jan 1, 1971
71.474
+71.474
0.0%
jan 1, 1972
73.935
+2.461
3.44%
jan 1, 1973
71.147
-2.788
-3.77%
jan 1, 1974
72.101
+0.954
1.34%
jan 1, 1975
72.581
+0.48
0.67%
jan 1, 1976
70.084
-2.496
-3.44%
jan 1, 1977
69.165
-0.919
-1.31%
jan 1, 1978
71.343
+2.178
3.15%
jan 1, 1979
69.656
-1.688
-2.37%
jan 1, 1980
68.764
-0.892
-1.28%
jan 1, 1981
67.63
-1.134
-1.65%
jan 1, 1982
69.022
+1.392
2.06%
jan 1, 1983
67.872
-1.151
-1.67%
jan 1, 1984
67.805
-0.066
-0.1%
jan 1, 1985
70.718
+2.913
4.3%
jan 1, 1986
70.683
-0.035
-0.05%
jan 1, 1987
70.428
-0.255
-0.36%
jan 1, 1988
70.25
-0.178
-0.25%
jan 1, 1989
71.923
+1.673
2.38%
jan 1, 1990
72.444
+0.521
0.72%
jan 1, 1991
69.777
-2.667
-3.68%
jan 1, 1992
70.034
+0.257
0.37%
jan 1, 1993
69.04
-0.994
-1.42%
jan 1, 1994
68.896
-0.144
-0.21%
jan 1, 1995
73.312
+4.416
6.41%
jan 1, 1996
73.354
+0.042
0.06%
jan 1, 1997
73.394
+0.04
0.05%
jan 1, 1998
74.136
+0.742
1.01%
jan 1, 1999
73.909
-0.227
-0.31%
jan 1, 2000
78.383
+4.473
6.05%
jan 1, 2001
76.149
-2.234
-2.85%
jan 1, 2002
80.709
+4.56
5.99%
jan 1, 2003
81.586
+0.877
1.09%
jan 1, 2004
83.018
+1.432
1.75%
jan 1, 2005
83.102
+0.084
0.1%
jan 1, 2006
82.395
-0.707
-0.85%
jan 1, 2007
84.391
+1.996
2.42%
jan 1, 2008
84.509
+0.118
0.14%
jan 1, 2009
84.558
+0.049
0.06%
Ranking of countries by current statistics by years


Comments: