29
/
en
AIzaSyAYiBZKx7MnpbEhh9jyipgxe19OcubqV5w
April 1, 2024
196480
Micronesia, Fed. Sts.
FSM
true
2
1
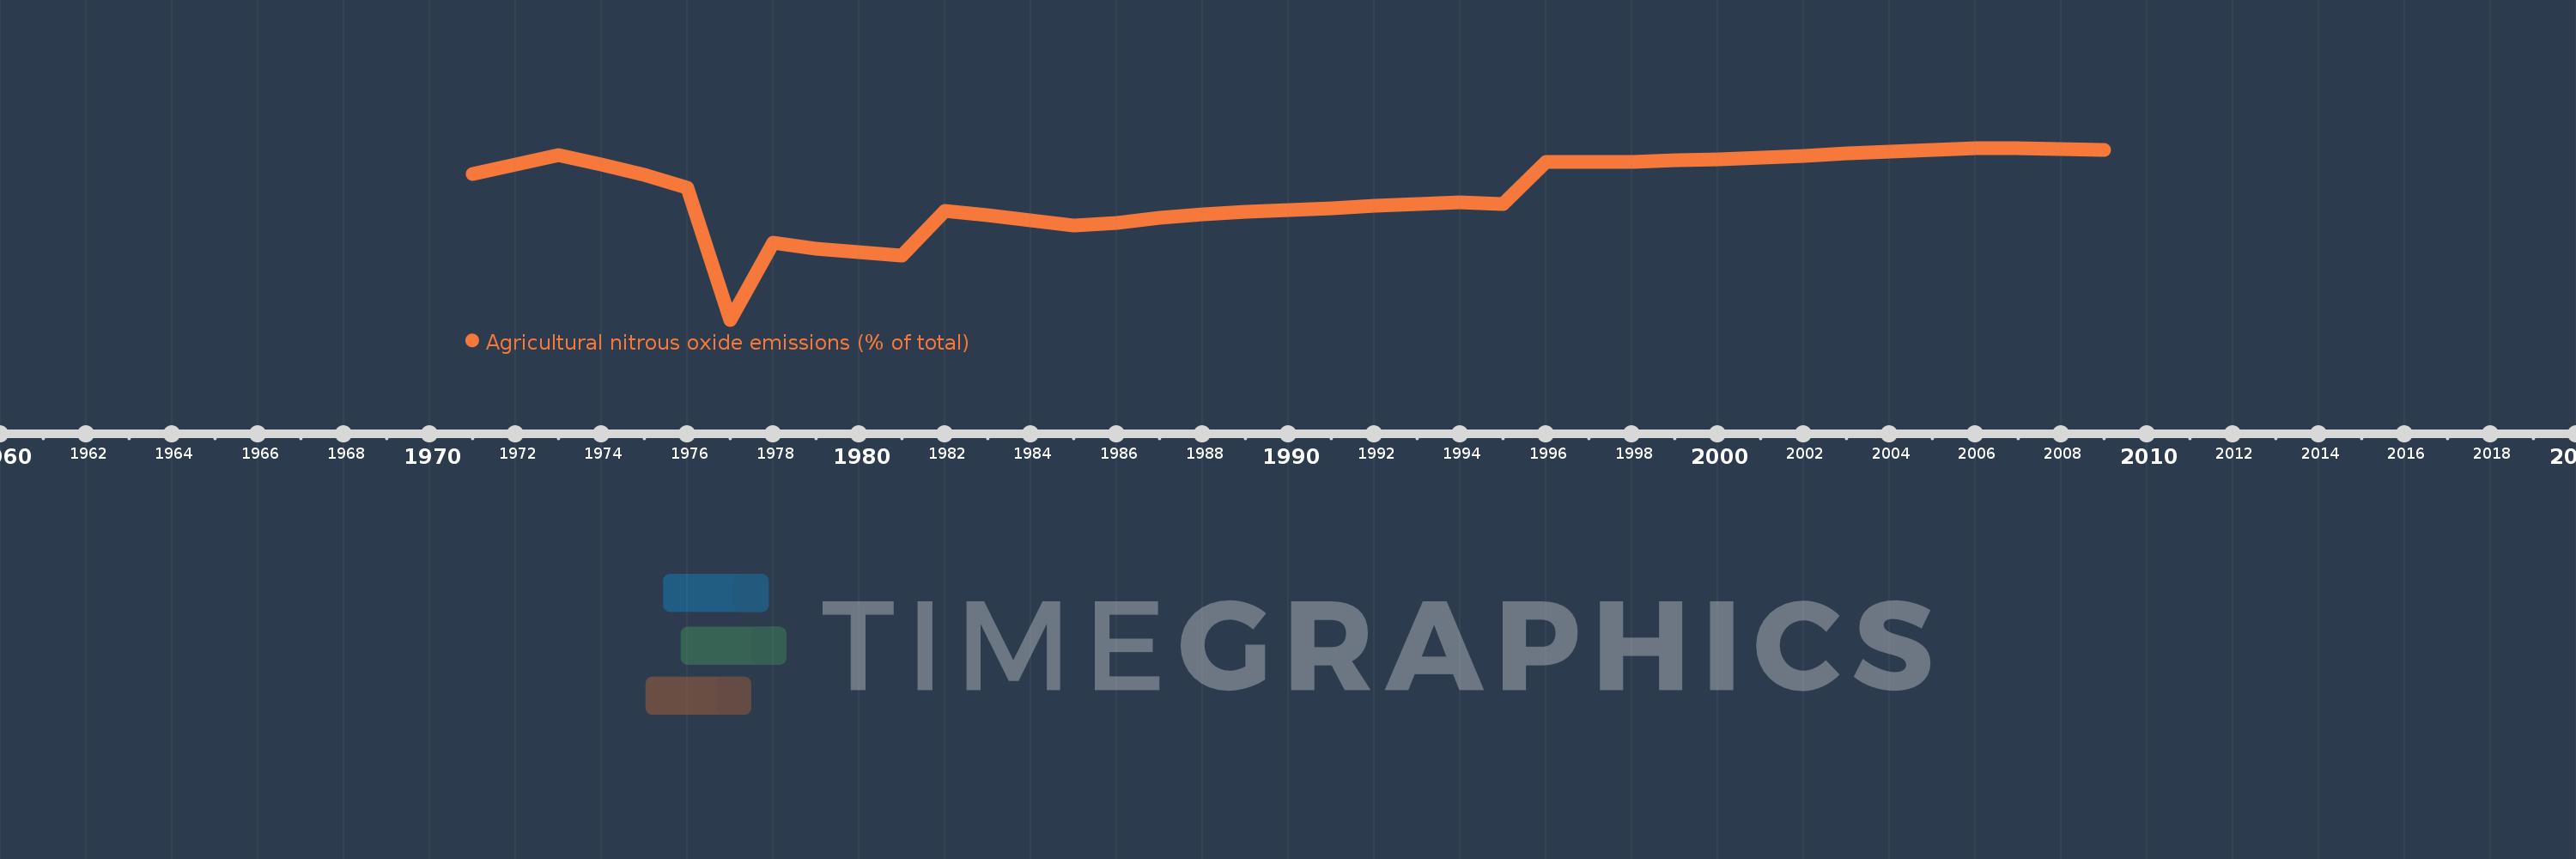
Agricultural nitrous oxide emissions (% of total)
2009,2008,2007,2006,2005,2004,2003,2002,2001,2000,1999,1998,1997,1996,1995,1994,1993,1992,1991,1990,1989,1988,1987,1986,1985,1984,1983,1982,1981,1980,1979,1978,1977,1976,1975,1974,1973,1972,1971
This statistics in other country:
AfghanistanAlbaniaAlgeriaAmerican SamoaAndorraAngolaAntigua and BarbudaArab WorldArgentinaArmeniaArubaAustraliaAustriaAzerbaijanBahamas, TheBahrainBangladeshBarbadosBelarusBelgiumBelizeBeninBermudaBhutanBoliviaBosnia and HerzegovinaBotswanaBrazilBritish Virgin IslandsBrunei DarussalamBulgariaBurkina FasoBurundiCabo VerdeCambodiaCameroonCanadaCaribbean small statesCayman IslandsCentral African RepublicCentral Europe and the BalticsChadChileChinaColombiaComorosCongo, Dem. Rep.Congo, Rep.Costa RicaCote d'IvoireCroatiaCubaCyprusCzech RepublicDenmarkDjiboutiDominicaDominican RepublicEarly-demographic dividendEast Asia & PacificEast Asia & Pacific (excluding high income)East Asia & Pacific (IDA & IBRD countries)EcuadorEgypt, Arab Rep.El SalvadorEquatorial GuineaEritreaEstoniaEthiopiaEuro areaEurope & Central AsiaEurope & Central Asia (excluding high income)Europe & Central Asia (IDA & IBRD countries)European UnionFaroe IslandsFijiFinlandFragile and conflict affected situationsFranceFrench PolynesiaGabonGambia, TheGeorgiaGermanyGhanaGibraltarGreeceGreenlandGrenadaGuamGuatemalaGuineaGuinea-BissauGuyanaHaitiHeavily indebted poor countries (HIPC)High incomeHondurasHong Kong SAR, ChinaHungaryIBRD onlyIcelandIDA & IBRD totalIDA blendIDA onlyIDA totalIndiaIndonesiaIran, Islamic Rep.IraqIrelandIsraelItalyJamaicaJapanJordanKazakhstanKenyaKiribatiKorea, Dem. People’s Rep.Korea, Rep.KuwaitKyrgyz RepublicLao PDRLate-demographic dividendLatin America & Caribbean Latin America & Caribbean (excluding high income)Latin America & the Caribbean (IDA & IBRD countries)LatviaLeast developed countries: UN classificationLebanonLesothoLiberiaLibyaLithuaniaLow & middle incomeLow incomeLower middle incomeLuxembourgMacao SAR, ChinaMacedonia, FYRMadagascarMalawiMalaysiaMaldivesMaliMaltaMarshall IslandsMauritaniaMauritiusMexicoMicronesia, Fed. Sts.Middle East & North AfricaMiddle East & North Africa (excluding high income)Middle East & North Africa (IDA & IBRD countries)Middle incomeMoldovaMongoliaMoroccoMozambiqueMyanmarNamibiaNauruNepalNetherlandsNew CaledoniaNew ZealandNicaraguaNigerNigeriaNorth AmericaNorthern Mariana IslandsNorwayOECD membersOmanOther small statesPacific island small statesPakistanPalauPanamaPapua New GuineaParaguayPeruPhilippinesPolandPortugalPost-demographic dividendPre-demographic dividendPuerto RicoQatarRomaniaRussian FederationRwandaSamoaSao Tome and PrincipeSaudi ArabiaSenegalSerbiaSeychellesSierra LeoneSingaporeSlovak RepublicSloveniaSmall statesSolomon IslandsSomaliaSouth AfricaSouth AsiaSouth Asia (IDA & IBRD)SpainSri LankaSt. Kitts and NevisSt. LuciaSt. Vincent and the GrenadinesSub-Saharan Africa Sub-Saharan Africa (excluding high income)Sub-Saharan Africa (IDA & IBRD countries)SudanSurinameSwazilandSwedenSwitzerlandSyrian Arab RepublicTajikistanTanzaniaThailandTimor-LesteTogoTongaTrinidad and TobagoTunisiaTurkeyTurkmenistanTurks and Caicos IslandsTuvaluUgandaUkraineUnited Arab EmiratesUnited KingdomUnited StatesUpper middle incomeUruguayUzbekistanVanuatuVenezuela, RBVietnamVirgin Islands (U.S.)WorldYemen, Rep.ZambiaZimbabwe Timeline:
This timeline shows a graph from 1971 to 2009 of Micronesia, Fed. Sts.. No data until 1970. Number of actual observations by date: 39.
Source name:
World Development Indicators
Source organization:
World Bank staff estimates from original source: European Commission, Joint Research Centre (JRC)/Netherlands Environmental Assessment Agency (PBL). Emission Database for Global Atmospheric Research (EDGAR): http://edgar.jrc.ec.europa.eu/.
Categories, topics:
Agriculture & Rural Development, Environment
Last updated:
apr 23, 2017
Indicators value changes by year
Minimum:
95.356
jan 1, 1977
Maximum:
98.227
jan 1, 2006
At the date of observation
Value
Absolute change
Change from previous value
jan 1, 1971
97.799
+97.799
0.0%
jan 1, 1972
97.949
+0.15
0.15%
jan 1, 1973
98.113
+0.164
0.17%
jan 1, 1974
97.948
-0.165
-0.17%
jan 1, 1975
97.778
-0.171
-0.17%
jan 1, 1976
97.559
-0.219
-0.22%
jan 1, 1977
95.356
-2.203
-2.26%
jan 1, 1978
96.64
+1.284
1.35%
jan 1, 1979
96.542
-0.098
-0.1%
jan 1, 1980
96.489
-0.053
-0.05%
jan 1, 1981
96.433
-0.056
-0.06%
jan 1, 1982
97.178
+0.744
0.77%
jan 1, 1983
97.097
-0.081
-0.08%
jan 1, 1984
97.016
-0.081
-0.08%
jan 1, 1985
96.937
-0.078
-0.08%
jan 1, 1986
96.972
+0.035
0.04%
jan 1, 1987
97.06
+0.088
0.09%
jan 1, 1988
97.121
+0.061
0.06%
jan 1, 1989
97.158
+0.037
0.04%
jan 1, 1990
97.191
+0.033
0.03%
jan 1, 1991
97.218
+0.027
0.03%
jan 1, 1992
97.255
+0.037
0.04%
jan 1, 1993
97.285
+0.029
0.03%
jan 1, 1994
97.319
+0.034
0.03%
jan 1, 1995
97.288
-0.031
-0.03%
jan 1, 1996
97.988
+0.7
0.72%
jan 1, 1997
97.992
+0.005
0.0%
jan 1, 1998
98.0
+0.008
0.01%
jan 1, 1999
98.021
+0.021
0.02%
jan 1, 2000
98.039
+0.019
0.02%
jan 1, 2001
98.062
+0.023
0.02%
jan 1, 2002
98.095
+0.033
0.03%
jan 1, 2003
98.135
+0.04
0.04%
jan 1, 2004
98.167
+0.033
0.03%
jan 1, 2005
98.196
+0.028
0.03%
jan 1, 2006
98.227
+0.032
0.03%
jan 1, 2007
98.218
-0.009
-0.01%
jan 1, 2008
98.208
-0.01
-0.01%
jan 1, 2009
98.197
-0.011
-0.01%
Ranking of countries by current statistics by years


Comments: