29
/
en
AIzaSyAYiBZKx7MnpbEhh9jyipgxe19OcubqV5w
April 1, 2024
271854
Uganda
UGA
true
2
1
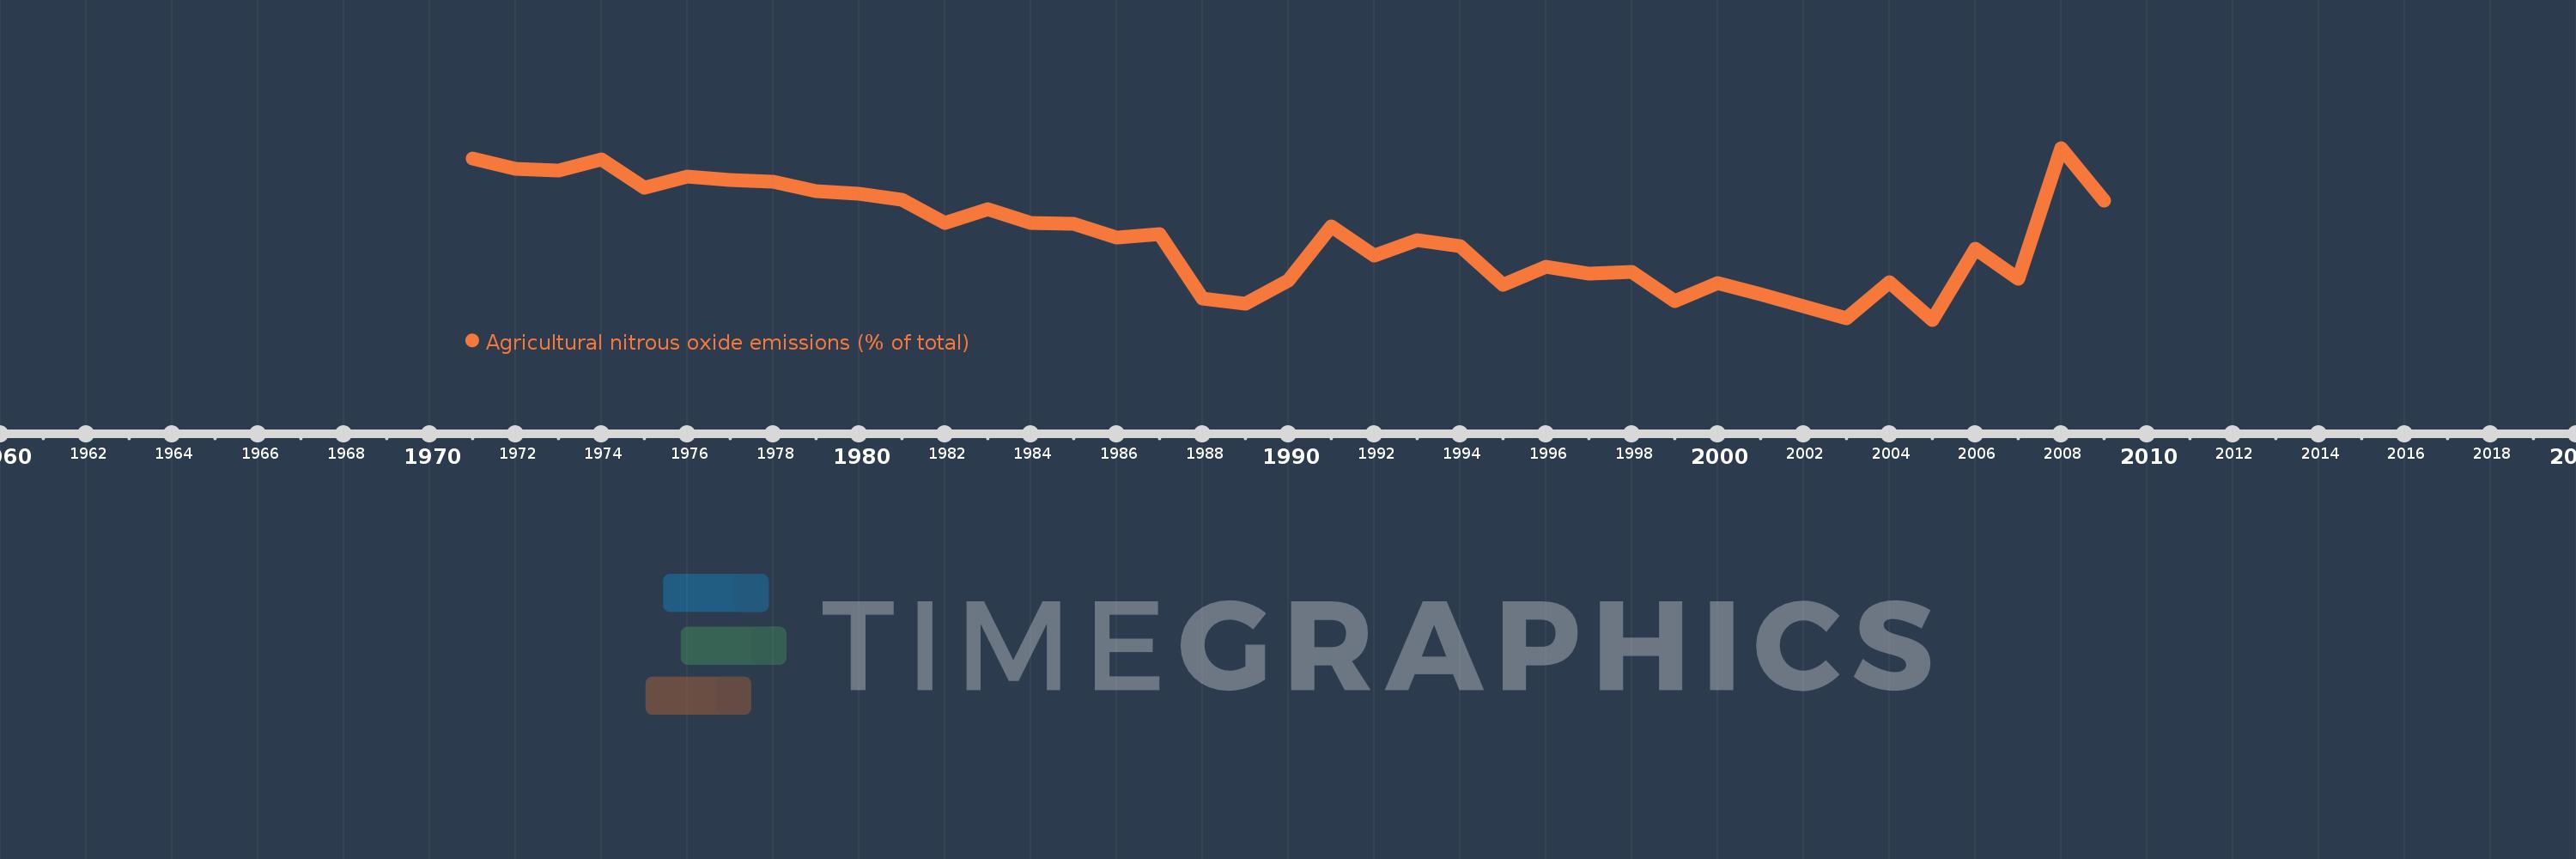
Agricultural nitrous oxide emissions (% of total)
2009,2008,2007,2006,2005,2004,2003,2002,2001,2000,1999,1998,1997,1996,1995,1994,1993,1992,1991,1990,1989,1988,1987,1986,1985,1984,1983,1982,1981,1980,1979,1978,1977,1976,1975,1974,1973,1972,1971
This statistics in other country:
AfghanistanAlbaniaAlgeriaAmerican SamoaAndorraAngolaAntigua and BarbudaArab WorldArgentinaArmeniaArubaAustraliaAustriaAzerbaijanBahamas, TheBahrainBangladeshBarbadosBelarusBelgiumBelizeBeninBermudaBhutanBoliviaBosnia and HerzegovinaBotswanaBrazilBritish Virgin IslandsBrunei DarussalamBulgariaBurkina FasoBurundiCabo VerdeCambodiaCameroonCanadaCaribbean small statesCayman IslandsCentral African RepublicCentral Europe and the BalticsChadChileChinaColombiaComorosCongo, Dem. Rep.Congo, Rep.Costa RicaCote d'IvoireCroatiaCubaCyprusCzech RepublicDenmarkDjiboutiDominicaDominican RepublicEarly-demographic dividendEast Asia & PacificEast Asia & Pacific (excluding high income)East Asia & Pacific (IDA & IBRD countries)EcuadorEgypt, Arab Rep.El SalvadorEquatorial GuineaEritreaEstoniaEthiopiaEuro areaEurope & Central AsiaEurope & Central Asia (excluding high income)Europe & Central Asia (IDA & IBRD countries)European UnionFaroe IslandsFijiFinlandFragile and conflict affected situationsFranceFrench PolynesiaGabonGambia, TheGeorgiaGermanyGhanaGibraltarGreeceGreenlandGrenadaGuamGuatemalaGuineaGuinea-BissauGuyanaHaitiHeavily indebted poor countries (HIPC)High incomeHondurasHong Kong SAR, ChinaHungaryIBRD onlyIcelandIDA & IBRD totalIDA blendIDA onlyIDA totalIndiaIndonesiaIran, Islamic Rep.IraqIrelandIsraelItalyJamaicaJapanJordanKazakhstanKenyaKiribatiKorea, Dem. People’s Rep.Korea, Rep.KuwaitKyrgyz RepublicLao PDRLate-demographic dividendLatin America & Caribbean Latin America & Caribbean (excluding high income)Latin America & the Caribbean (IDA & IBRD countries)LatviaLeast developed countries: UN classificationLebanonLesothoLiberiaLibyaLithuaniaLow & middle incomeLow incomeLower middle incomeLuxembourgMacao SAR, ChinaMacedonia, FYRMadagascarMalawiMalaysiaMaldivesMaliMaltaMarshall IslandsMauritaniaMauritiusMexicoMicronesia, Fed. Sts.Middle East & North AfricaMiddle East & North Africa (excluding high income)Middle East & North Africa (IDA & IBRD countries)Middle incomeMoldovaMongoliaMoroccoMozambiqueMyanmarNamibiaNauruNepalNetherlandsNew CaledoniaNew ZealandNicaraguaNigerNigeriaNorth AmericaNorthern Mariana IslandsNorwayOECD membersOmanOther small statesPacific island small statesPakistanPalauPanamaPapua New GuineaParaguayPeruPhilippinesPolandPortugalPost-demographic dividendPre-demographic dividendPuerto RicoQatarRomaniaRussian FederationRwandaSamoaSao Tome and PrincipeSaudi ArabiaSenegalSerbiaSeychellesSierra LeoneSingaporeSlovak RepublicSloveniaSmall statesSolomon IslandsSomaliaSouth AfricaSouth AsiaSouth Asia (IDA & IBRD)SpainSri LankaSt. Kitts and NevisSt. LuciaSt. Vincent and the GrenadinesSub-Saharan Africa Sub-Saharan Africa (excluding high income)Sub-Saharan Africa (IDA & IBRD countries)SudanSurinameSwazilandSwedenSwitzerlandSyrian Arab RepublicTajikistanTanzaniaThailandTimor-LesteTogoTongaTrinidad and TobagoTunisiaTurkeyTurkmenistanTurks and Caicos IslandsTuvaluUgandaUkraineUnited Arab EmiratesUnited KingdomUnited StatesUpper middle incomeUruguayUzbekistanVanuatuVenezuela, RBVietnamVirgin Islands (U.S.)WorldYemen, Rep.ZambiaZimbabwe Timeline:
This timeline shows a graph from 1971 to 2009 of Uganda. No data until 1970. Number of actual observations by date: 39.
Source name:
World Development Indicators
Source organization:
World Bank staff estimates from original source: European Commission, Joint Research Centre (JRC)/Netherlands Environmental Assessment Agency (PBL). Emission Database for Global Atmospheric Research (EDGAR): http://edgar.jrc.ec.europa.eu/.
Categories, topics:
Agriculture & Rural Development, Environment
Last updated:
apr 23, 2017
Indicators value changes by year
Minimum:
83.338
jan 1, 2005
Maximum:
87.258
jan 1, 2008
At the date of observation
Value
Absolute change
Change from previous value
jan 1, 1971
87.024
+87.024
0.0%
jan 1, 1972
86.779
-0.244
-0.28%
jan 1, 1973
86.746
-0.033
-0.04%
jan 1, 1974
86.992
+0.246
0.28%
jan 1, 1975
86.357
-0.635
-0.73%
jan 1, 1976
86.603
+0.246
0.28%
jan 1, 1977
86.533
-0.071
-0.08%
jan 1, 1978
86.489
-0.043
-0.05%
jan 1, 1979
86.275
-0.214
-0.25%
jan 1, 1980
86.215
-0.059
-0.07%
jan 1, 1981
86.067
-0.149
-0.17%
jan 1, 1982
85.55
-0.517
-0.6%
jan 1, 1983
85.867
+0.317
0.37%
jan 1, 1984
85.552
-0.315
-0.37%
jan 1, 1985
85.531
-0.022
-0.03%
jan 1, 1986
85.218
-0.313
-0.37%
jan 1, 1987
85.296
+0.078
0.09%
jan 1, 1988
83.825
-1.471
-1.72%
jan 1, 1989
83.708
-0.118
-0.14%
jan 1, 1990
84.238
+0.53
0.63%
jan 1, 1991
85.46
+1.223
1.45%
jan 1, 1992
84.809
-0.651
-0.76%
jan 1, 1993
85.161
+0.352
0.41%
jan 1, 1994
85.025
-0.137
-0.16%
jan 1, 1995
84.128
-0.897
-1.05%
jan 1, 1996
84.551
+0.423
0.5%
jan 1, 1997
84.396
-0.155
-0.18%
jan 1, 1998
84.431
+0.035
0.04%
jan 1, 1999
83.764
-0.667
-0.79%
jan 1, 2000
84.174
+0.41
0.49%
jan 1, 2001
83.912
-0.262
-0.31%
jan 1, 2002
83.64
-0.272
-0.32%
jan 1, 2003
83.369
-0.271
-0.32%
jan 1, 2004
84.189
+0.82
0.98%
jan 1, 2005
83.338
-0.851
-1.01%
jan 1, 2006
84.95
+1.612
1.93%
jan 1, 2007
84.275
-0.675
-0.79%
jan 1, 2008
87.258
+2.983
3.54%
jan 1, 2009
86.051
-1.207
-1.38%
Ranking of countries by current statistics by years


Comments: