29
/
en
AIzaSyAYiBZKx7MnpbEhh9jyipgxe19OcubqV5w
April 1, 2024
29650
Euro area
EMU
false
2
1
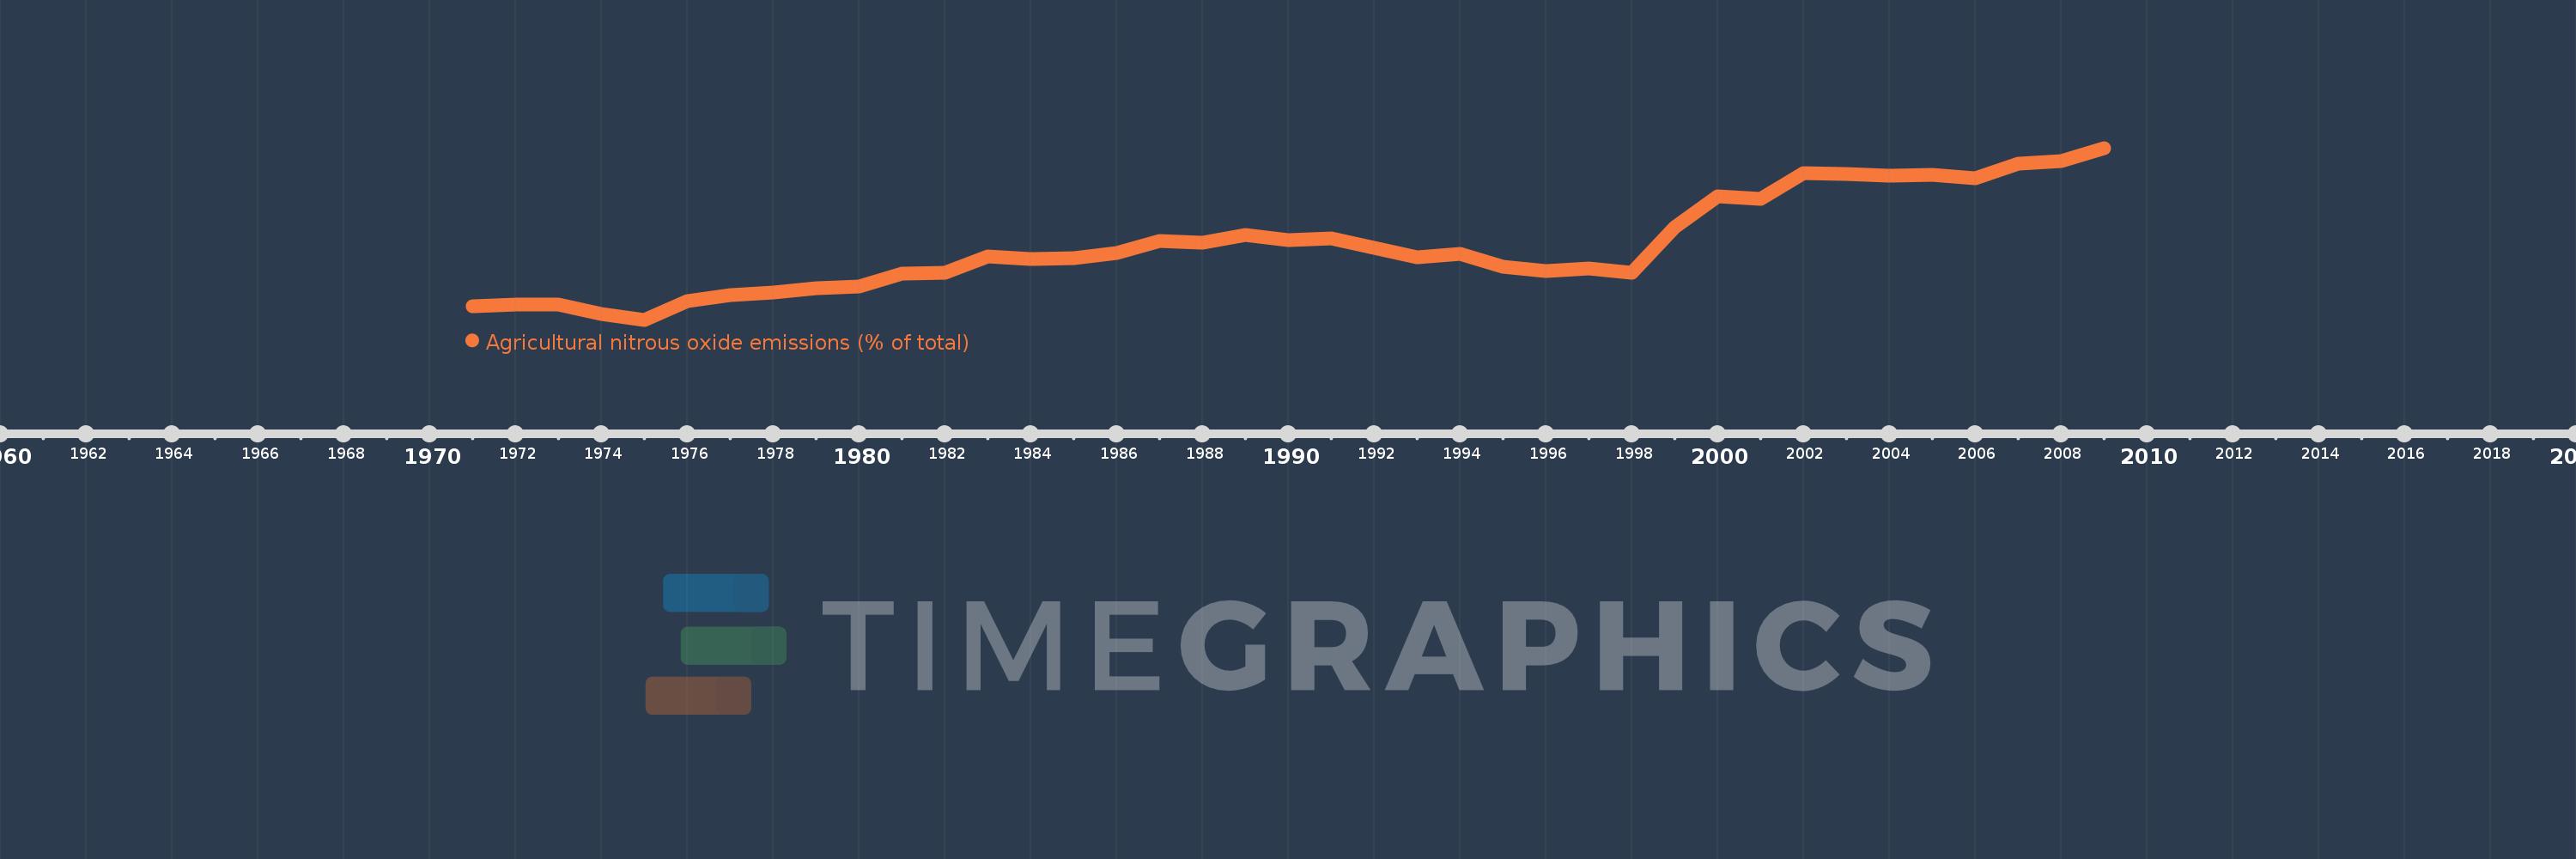
Agricultural nitrous oxide emissions (% of total)
2009,2008,2007,2006,2005,2004,2003,2002,2001,2000,1999,1998,1997,1996,1995,1994,1993,1992,1991,1990,1989,1988,1987,1986,1985,1984,1983,1982,1981,1980,1979,1978,1977,1976,1975,1974,1973,1972,1971
This statistics in other country:
AfghanistanAlbaniaAlgeriaAmerican SamoaAndorraAngolaAntigua and BarbudaArab WorldArgentinaArmeniaArubaAustraliaAustriaAzerbaijanBahamas, TheBahrainBangladeshBarbadosBelarusBelgiumBelizeBeninBermudaBhutanBoliviaBosnia and HerzegovinaBotswanaBrazilBritish Virgin IslandsBrunei DarussalamBulgariaBurkina FasoBurundiCabo VerdeCambodiaCameroonCanadaCaribbean small statesCayman IslandsCentral African RepublicCentral Europe and the BalticsChadChileChinaColombiaComorosCongo, Dem. Rep.Congo, Rep.Costa RicaCote d'IvoireCroatiaCubaCyprusCzech RepublicDenmarkDjiboutiDominicaDominican RepublicEarly-demographic dividendEast Asia & PacificEast Asia & Pacific (excluding high income)East Asia & Pacific (IDA & IBRD countries)EcuadorEgypt, Arab Rep.El SalvadorEquatorial GuineaEritreaEstoniaEthiopiaEuro areaEurope & Central AsiaEurope & Central Asia (excluding high income)Europe & Central Asia (IDA & IBRD countries)European UnionFaroe IslandsFijiFinlandFragile and conflict affected situationsFranceFrench PolynesiaGabonGambia, TheGeorgiaGermanyGhanaGibraltarGreeceGreenlandGrenadaGuamGuatemalaGuineaGuinea-BissauGuyanaHaitiHeavily indebted poor countries (HIPC)High incomeHondurasHong Kong SAR, ChinaHungaryIBRD onlyIcelandIDA & IBRD totalIDA blendIDA onlyIDA totalIndiaIndonesiaIran, Islamic Rep.IraqIrelandIsraelItalyJamaicaJapanJordanKazakhstanKenyaKiribatiKorea, Dem. People’s Rep.Korea, Rep.KuwaitKyrgyz RepublicLao PDRLate-demographic dividendLatin America & Caribbean Latin America & Caribbean (excluding high income)Latin America & the Caribbean (IDA & IBRD countries)LatviaLeast developed countries: UN classificationLebanonLesothoLiberiaLibyaLithuaniaLow & middle incomeLow incomeLower middle incomeLuxembourgMacao SAR, ChinaMacedonia, FYRMadagascarMalawiMalaysiaMaldivesMaliMaltaMarshall IslandsMauritaniaMauritiusMexicoMicronesia, Fed. Sts.Middle East & North AfricaMiddle East & North Africa (excluding high income)Middle East & North Africa (IDA & IBRD countries)Middle incomeMoldovaMongoliaMoroccoMozambiqueMyanmarNamibiaNauruNepalNetherlandsNew CaledoniaNew ZealandNicaraguaNigerNigeriaNorth AmericaNorthern Mariana IslandsNorwayOECD membersOmanOther small statesPacific island small statesPakistanPalauPanamaPapua New GuineaParaguayPeruPhilippinesPolandPortugalPost-demographic dividendPre-demographic dividendPuerto RicoQatarRomaniaRussian FederationRwandaSamoaSao Tome and PrincipeSaudi ArabiaSenegalSerbiaSeychellesSierra LeoneSingaporeSlovak RepublicSloveniaSmall statesSolomon IslandsSomaliaSouth AfricaSouth AsiaSouth Asia (IDA & IBRD)SpainSri LankaSt. Kitts and NevisSt. LuciaSt. Vincent and the GrenadinesSub-Saharan Africa Sub-Saharan Africa (excluding high income)Sub-Saharan Africa (IDA & IBRD countries)SudanSurinameSwazilandSwedenSwitzerlandSyrian Arab RepublicTajikistanTanzaniaThailandTimor-LesteTogoTongaTrinidad and TobagoTunisiaTurkeyTurkmenistanTurks and Caicos IslandsTuvaluUgandaUkraineUnited Arab EmiratesUnited KingdomUnited StatesUpper middle incomeUruguayUzbekistanVanuatuVenezuela, RBVietnamVirgin Islands (U.S.)WorldYemen, Rep.ZambiaZimbabwe Timeline:
This timeline shows a graph from 1971 to 2009 of Euro area. No data until 1970. Number of actual observations by date: 39.
Source name:
World Development Indicators
Source organization:
World Bank staff estimates from original source: European Commission, Joint Research Centre (JRC)/Netherlands Environmental Assessment Agency (PBL). Emission Database for Global Atmospheric Research (EDGAR): http://edgar.jrc.ec.europa.eu/.
Categories, topics:
Agriculture & Rural Development, Environment
Last updated:
apr 23, 2017
Indicators value changes by year
Minimum:
41.823
jan 1, 1975
Maximum:
60.378
jan 1, 2009
At the date of observation
Value
Absolute change
Change from previous value
jan 1, 1971
43.299
+43.299
0.0%
jan 1, 1972
43.42
+0.121
0.28%
jan 1, 1973
43.489
+0.069
0.16%
jan 1, 1974
42.467
-1.022
-2.35%
jan 1, 1975
41.823
-0.644
-1.52%
jan 1, 1976
43.85
+2.027
4.85%
jan 1, 1977
44.467
+0.617
1.41%
jan 1, 1978
44.76
+0.293
0.66%
jan 1, 1979
45.203
+0.443
0.99%
jan 1, 1980
45.417
+0.215
0.47%
jan 1, 1981
46.809
+1.391
3.06%
jan 1, 1982
46.89
+0.082
0.17%
jan 1, 1983
48.681
+1.791
3.82%
jan 1, 1984
48.365
-0.316
-0.65%
jan 1, 1985
48.454
+0.09
0.19%
jan 1, 1986
49.047
+0.593
1.22%
jan 1, 1987
50.326
+1.279
2.61%
jan 1, 1988
50.137
-0.189
-0.38%
jan 1, 1989
50.986
+0.85
1.69%
jan 1, 1990
50.467
-0.519
-1.02%
jan 1, 1991
50.65
+0.183
0.36%
jan 1, 1992
49.625
-1.025
-2.02%
jan 1, 1993
48.576
-1.049
-2.11%
jan 1, 1994
48.961
+0.385
0.79%
jan 1, 1995
47.517
-1.445
-2.95%
jan 1, 1996
47.12
-0.397
-0.84%
jan 1, 1997
47.379
+0.259
0.55%
jan 1, 1998
46.941
-0.438
-0.92%
jan 1, 1999
51.831
+4.89
10.42%
jan 1, 2000
55.172
+3.341
6.45%
jan 1, 2001
54.886
-0.286
-0.52%
jan 1, 2002
57.676
+2.79
5.08%
jan 1, 2003
57.562
-0.114
-0.2%
jan 1, 2004
57.343
-0.219
-0.38%
jan 1, 2005
57.517
+0.174
0.3%
jan 1, 2006
57.103
-0.413
-0.72%
jan 1, 2007
58.672
+1.569
2.75%
jan 1, 2008
59.004
+0.331
0.56%
jan 1, 2009
60.378
+1.374
2.33%
Ranking of countries by current statistics by years


Comments: