29
/
en
AIzaSyAYiBZKx7MnpbEhh9jyipgxe19OcubqV5w
April 1, 2024
31298
Europe & Central Asia (excluding high income)
ECA
false
2
1
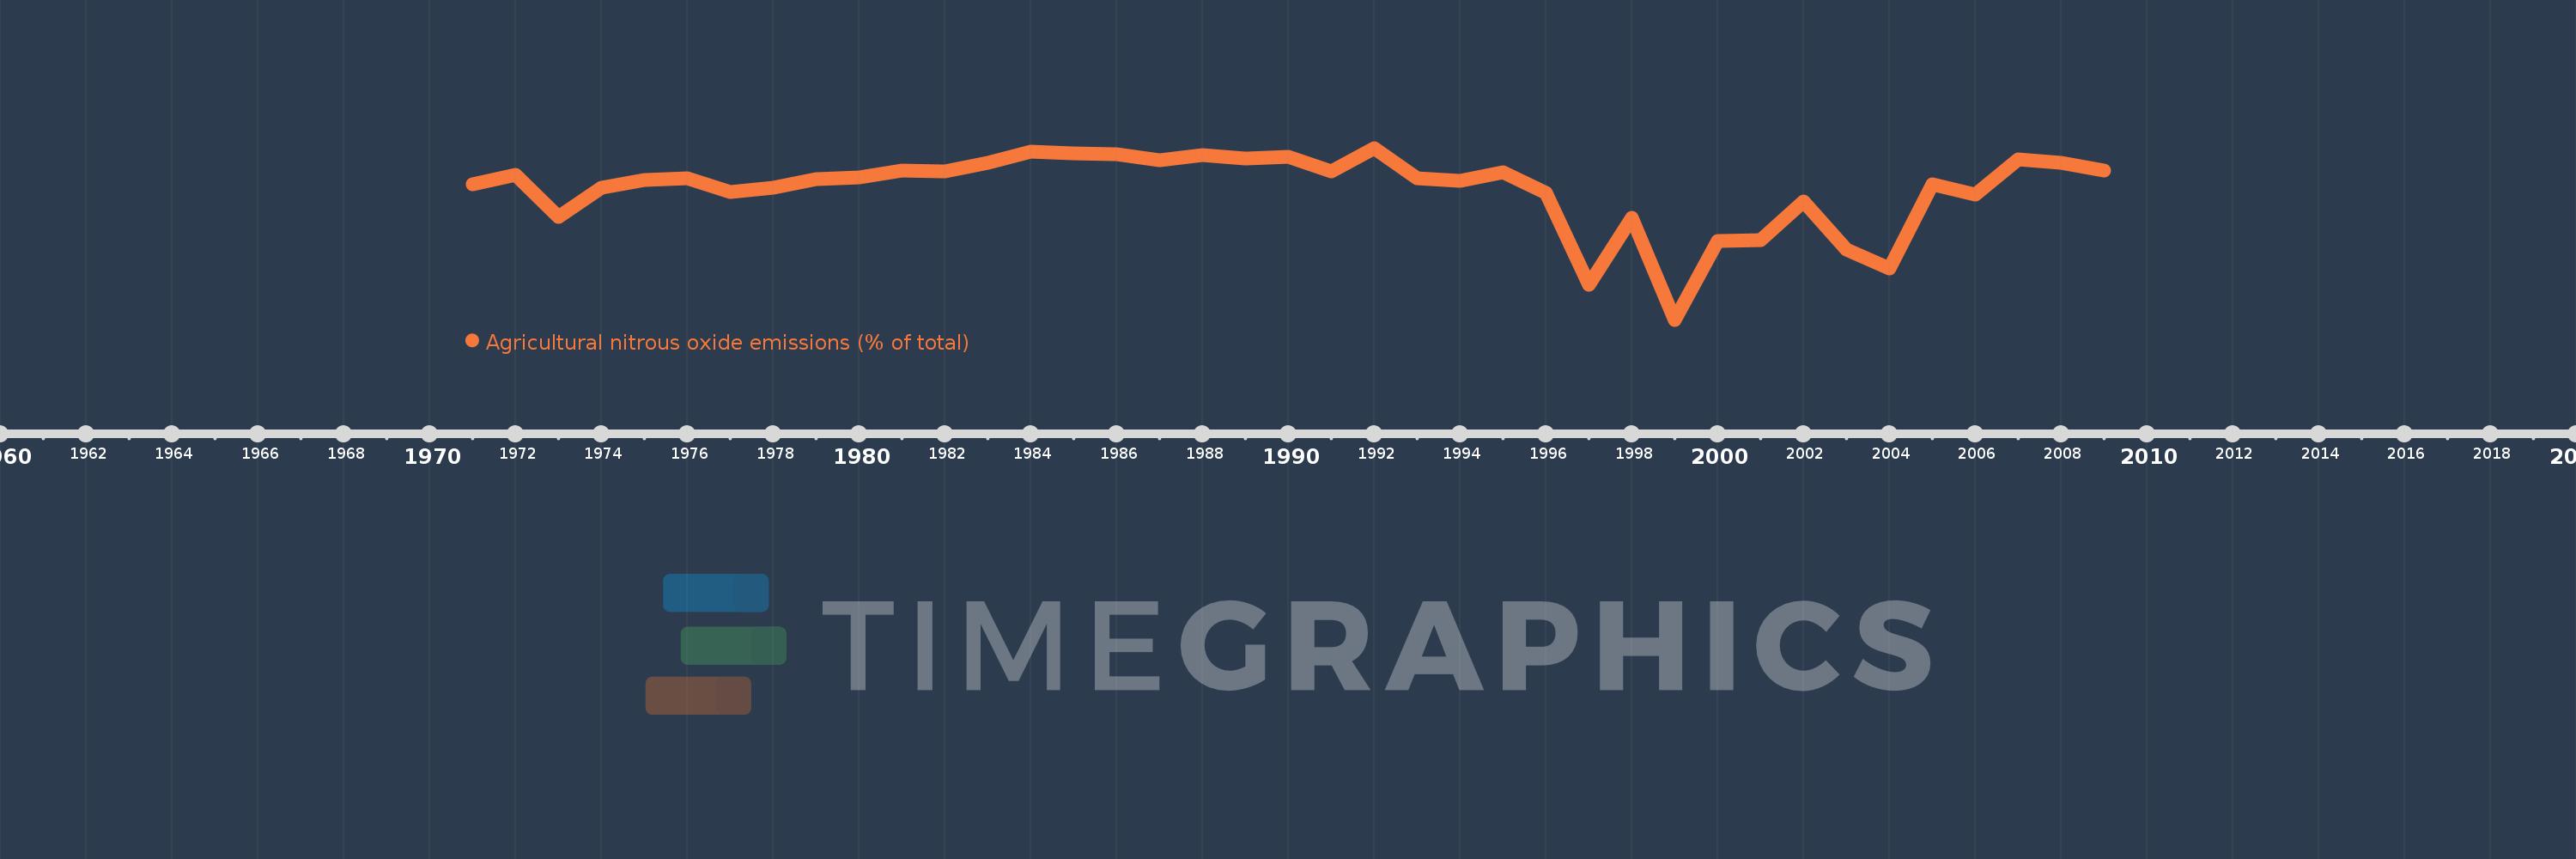
Agricultural nitrous oxide emissions (% of total)
2009,2008,2007,2006,2005,2004,2003,2002,2001,2000,1999,1998,1997,1996,1995,1994,1993,1992,1991,1990,1989,1988,1987,1986,1985,1984,1983,1982,1981,1980,1979,1978,1977,1976,1975,1974,1973,1972,1971
This statistics in other country:
AfghanistanAlbaniaAlgeriaAmerican SamoaAndorraAngolaAntigua and BarbudaArab WorldArgentinaArmeniaArubaAustraliaAustriaAzerbaijanBahamas, TheBahrainBangladeshBarbadosBelarusBelgiumBelizeBeninBermudaBhutanBoliviaBosnia and HerzegovinaBotswanaBrazilBritish Virgin IslandsBrunei DarussalamBulgariaBurkina FasoBurundiCabo VerdeCambodiaCameroonCanadaCaribbean small statesCayman IslandsCentral African RepublicCentral Europe and the BalticsChadChileChinaColombiaComorosCongo, Dem. Rep.Congo, Rep.Costa RicaCote d'IvoireCroatiaCubaCyprusCzech RepublicDenmarkDjiboutiDominicaDominican RepublicEarly-demographic dividendEast Asia & PacificEast Asia & Pacific (excluding high income)East Asia & Pacific (IDA & IBRD countries)EcuadorEgypt, Arab Rep.El SalvadorEquatorial GuineaEritreaEstoniaEthiopiaEuro areaEurope & Central AsiaEurope & Central Asia (excluding high income)Europe & Central Asia (IDA & IBRD countries)European UnionFaroe IslandsFijiFinlandFragile and conflict affected situationsFranceFrench PolynesiaGabonGambia, TheGeorgiaGermanyGhanaGibraltarGreeceGreenlandGrenadaGuamGuatemalaGuineaGuinea-BissauGuyanaHaitiHeavily indebted poor countries (HIPC)High incomeHondurasHong Kong SAR, ChinaHungaryIBRD onlyIcelandIDA & IBRD totalIDA blendIDA onlyIDA totalIndiaIndonesiaIran, Islamic Rep.IraqIrelandIsraelItalyJamaicaJapanJordanKazakhstanKenyaKiribatiKorea, Dem. People’s Rep.Korea, Rep.KuwaitKyrgyz RepublicLao PDRLate-demographic dividendLatin America & Caribbean Latin America & Caribbean (excluding high income)Latin America & the Caribbean (IDA & IBRD countries)LatviaLeast developed countries: UN classificationLebanonLesothoLiberiaLibyaLithuaniaLow & middle incomeLow incomeLower middle incomeLuxembourgMacao SAR, ChinaMacedonia, FYRMadagascarMalawiMalaysiaMaldivesMaliMaltaMarshall IslandsMauritaniaMauritiusMexicoMicronesia, Fed. Sts.Middle East & North AfricaMiddle East & North Africa (excluding high income)Middle East & North Africa (IDA & IBRD countries)Middle incomeMoldovaMongoliaMoroccoMozambiqueMyanmarNamibiaNauruNepalNetherlandsNew CaledoniaNew ZealandNicaraguaNigerNigeriaNorth AmericaNorthern Mariana IslandsNorwayOECD membersOmanOther small statesPacific island small statesPakistanPalauPanamaPapua New GuineaParaguayPeruPhilippinesPolandPortugalPost-demographic dividendPre-demographic dividendPuerto RicoQatarRomaniaRussian FederationRwandaSamoaSao Tome and PrincipeSaudi ArabiaSenegalSerbiaSeychellesSierra LeoneSingaporeSlovak RepublicSloveniaSmall statesSolomon IslandsSomaliaSouth AfricaSouth AsiaSouth Asia (IDA & IBRD)SpainSri LankaSt. Kitts and NevisSt. LuciaSt. Vincent and the GrenadinesSub-Saharan Africa Sub-Saharan Africa (excluding high income)Sub-Saharan Africa (IDA & IBRD countries)SudanSurinameSwazilandSwedenSwitzerlandSyrian Arab RepublicTajikistanTanzaniaThailandTimor-LesteTogoTongaTrinidad and TobagoTunisiaTurkeyTurkmenistanTurks and Caicos IslandsTuvaluUgandaUkraineUnited Arab EmiratesUnited KingdomUnited StatesUpper middle incomeUruguayUzbekistanVanuatuVenezuela, RBVietnamVirgin Islands (U.S.)WorldYemen, Rep.ZambiaZimbabwe Timeline:
This timeline shows a graph from 1971 to 2009 of Europe & Central Asia (excluding high income). No data until 1970. Number of actual observations by date: 39.
Source name:
World Development Indicators
Source organization:
World Bank staff estimates from original source: European Commission, Joint Research Centre (JRC)/Netherlands Environmental Assessment Agency (PBL). Emission Database for Global Atmospheric Research (EDGAR): http://edgar.jrc.ec.europa.eu/.
Categories, topics:
Agriculture & Rural Development, Environment
Last updated:
apr 23, 2017
Indicators value changes by year
Minimum:
39.855
jan 1, 1999
Maximum:
61.519
jan 1, 1992
At the date of observation
Value
Absolute change
Change from previous value
jan 1, 1971
56.916
+56.916
0.0%
jan 1, 1972
58.165
+1.249
2.19%
jan 1, 1973
52.817
-5.348
-9.2%
jan 1, 1974
56.545
+3.729
7.06%
jan 1, 1975
57.441
+0.896
1.58%
jan 1, 1976
57.689
+0.248
0.43%
jan 1, 1977
55.944
-1.745
-3.03%
jan 1, 1978
56.551
+0.607
1.08%
jan 1, 1979
57.56
+1.009
1.78%
jan 1, 1980
57.8
+0.24
0.42%
jan 1, 1981
58.644
+0.844
1.46%
jan 1, 1982
58.559
-0.085
-0.14%
jan 1, 1983
59.609
+1.05
1.79%
jan 1, 1984
61.106
+1.497
2.51%
jan 1, 1985
60.84
-0.266
-0.43%
jan 1, 1986
60.763
-0.078
-0.13%
jan 1, 1987
59.97
-0.792
-1.3%
jan 1, 1988
60.584
+0.614
1.02%
jan 1, 1989
60.215
-0.369
-0.61%
jan 1, 1990
60.376
+0.161
0.27%
jan 1, 1991
58.511
-1.865
-3.09%
jan 1, 1992
61.519
+3.008
5.14%
jan 1, 1993
57.749
-3.77
-6.13%
jan 1, 1994
57.334
-0.414
-0.72%
jan 1, 1995
58.429
+1.094
1.91%
jan 1, 1996
55.834
-2.594
-4.44%
jan 1, 1997
44.219
-11.615
-20.8%
jan 1, 1998
52.74
+8.52
19.27%
jan 1, 1999
39.855
-12.885
-24.43%
jan 1, 2000
49.828
+9.973
25.02%
jan 1, 2001
49.847
+0.019
0.04%
jan 1, 2002
54.809
+4.962
9.96%
jan 1, 2003
48.741
-6.068
-11.07%
jan 1, 2004
46.291
-2.45
-5.03%
jan 1, 2005
56.907
+10.616
22.93%
jan 1, 2006
55.591
-1.316
-2.31%
jan 1, 2007
60.094
+4.503
8.1%
jan 1, 2008
59.66
-0.434
-0.72%
jan 1, 2009
58.686
-0.974
-1.63%
Ranking of countries by current statistics by years


Comments: