29
/
en
AIzaSyAYiBZKx7MnpbEhh9jyipgxe19OcubqV5w
April 1, 2024
118633
Denmark
DNK
true
2
1
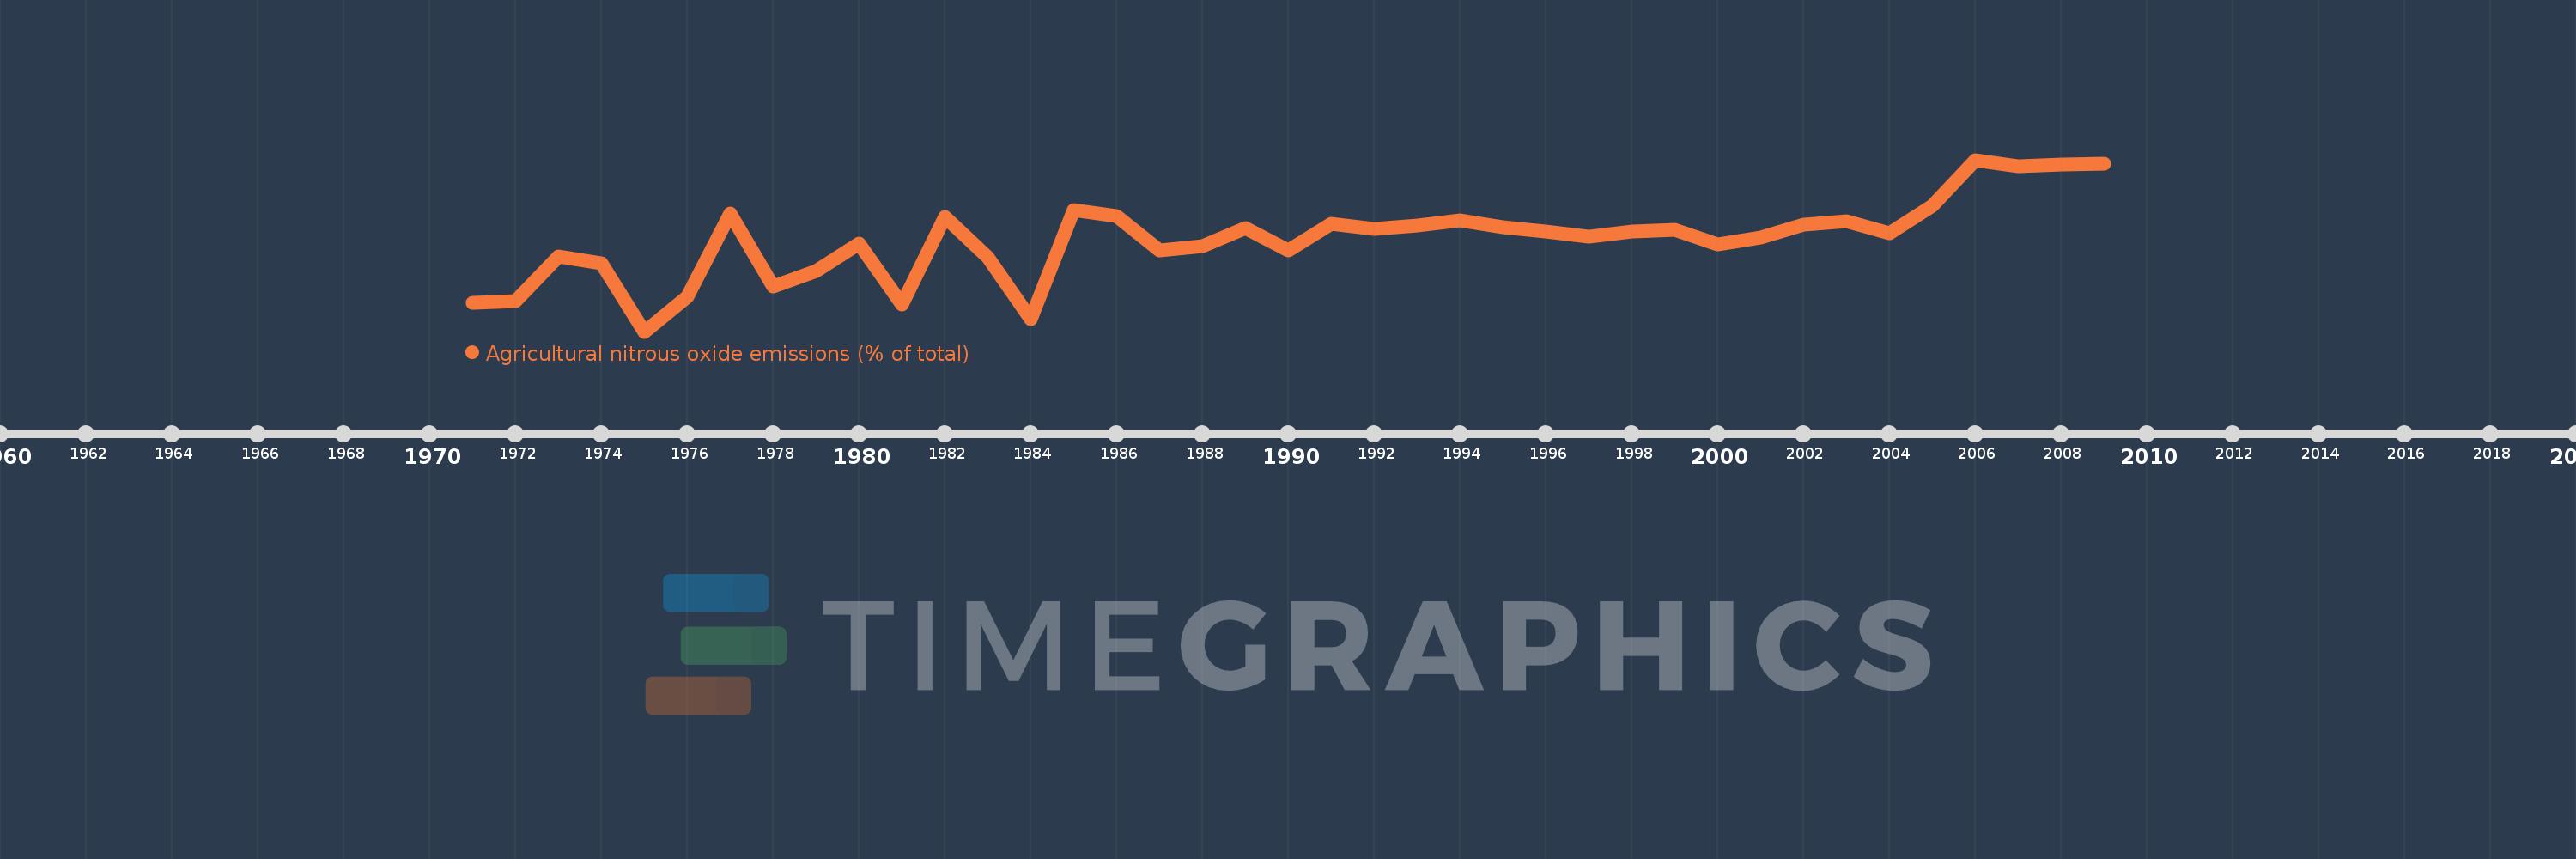
Agricultural nitrous oxide emissions (% of total)
2009,2008,2007,2006,2005,2004,2003,2002,2001,2000,1999,1998,1997,1996,1995,1994,1993,1992,1991,1990,1989,1988,1987,1986,1985,1984,1983,1982,1981,1980,1979,1978,1977,1976,1975,1974,1973,1972,1971
This statistics in other country:
AfghanistanAlbaniaAlgeriaAmerican SamoaAndorraAngolaAntigua and BarbudaArab WorldArgentinaArmeniaArubaAustraliaAustriaAzerbaijanBahamas, TheBahrainBangladeshBarbadosBelarusBelgiumBelizeBeninBermudaBhutanBoliviaBosnia and HerzegovinaBotswanaBrazilBritish Virgin IslandsBrunei DarussalamBulgariaBurkina FasoBurundiCabo VerdeCambodiaCameroonCanadaCaribbean small statesCayman IslandsCentral African RepublicCentral Europe and the BalticsChadChileChinaColombiaComorosCongo, Dem. Rep.Congo, Rep.Costa RicaCote d'IvoireCroatiaCubaCyprusCzech RepublicDenmarkDjiboutiDominicaDominican RepublicEarly-demographic dividendEast Asia & PacificEast Asia & Pacific (excluding high income)East Asia & Pacific (IDA & IBRD countries)EcuadorEgypt, Arab Rep.El SalvadorEquatorial GuineaEritreaEstoniaEthiopiaEuro areaEurope & Central AsiaEurope & Central Asia (excluding high income)Europe & Central Asia (IDA & IBRD countries)European UnionFaroe IslandsFijiFinlandFragile and conflict affected situationsFranceFrench PolynesiaGabonGambia, TheGeorgiaGermanyGhanaGibraltarGreeceGreenlandGrenadaGuamGuatemalaGuineaGuinea-BissauGuyanaHaitiHeavily indebted poor countries (HIPC)High incomeHondurasHong Kong SAR, ChinaHungaryIBRD onlyIcelandIDA & IBRD totalIDA blendIDA onlyIDA totalIndiaIndonesiaIran, Islamic Rep.IraqIrelandIsraelItalyJamaicaJapanJordanKazakhstanKenyaKiribatiKorea, Dem. People’s Rep.Korea, Rep.KuwaitKyrgyz RepublicLao PDRLate-demographic dividendLatin America & Caribbean Latin America & Caribbean (excluding high income)Latin America & the Caribbean (IDA & IBRD countries)LatviaLeast developed countries: UN classificationLebanonLesothoLiberiaLibyaLithuaniaLow & middle incomeLow incomeLower middle incomeLuxembourgMacao SAR, ChinaMacedonia, FYRMadagascarMalawiMalaysiaMaldivesMaliMaltaMarshall IslandsMauritaniaMauritiusMexicoMicronesia, Fed. Sts.Middle East & North AfricaMiddle East & North Africa (excluding high income)Middle East & North Africa (IDA & IBRD countries)Middle incomeMoldovaMongoliaMoroccoMozambiqueMyanmarNamibiaNauruNepalNetherlandsNew CaledoniaNew ZealandNicaraguaNigerNigeriaNorth AmericaNorthern Mariana IslandsNorwayOECD membersOmanOther small statesPacific island small statesPakistanPalauPanamaPapua New GuineaParaguayPeruPhilippinesPolandPortugalPost-demographic dividendPre-demographic dividendPuerto RicoQatarRomaniaRussian FederationRwandaSamoaSao Tome and PrincipeSaudi ArabiaSenegalSerbiaSeychellesSierra LeoneSingaporeSlovak RepublicSloveniaSmall statesSolomon IslandsSomaliaSouth AfricaSouth AsiaSouth Asia (IDA & IBRD)SpainSri LankaSt. Kitts and NevisSt. LuciaSt. Vincent and the GrenadinesSub-Saharan Africa Sub-Saharan Africa (excluding high income)Sub-Saharan Africa (IDA & IBRD countries)SudanSurinameSwazilandSwedenSwitzerlandSyrian Arab RepublicTajikistanTanzaniaThailandTimor-LesteTogoTongaTrinidad and TobagoTunisiaTurkeyTurkmenistanTurks and Caicos IslandsTuvaluUgandaUkraineUnited Arab EmiratesUnited KingdomUnited StatesUpper middle incomeUruguayUzbekistanVanuatuVenezuela, RBVietnamVirgin Islands (U.S.)WorldYemen, Rep.ZambiaZimbabwe Timeline:
This timeline shows a graph from 1971 to 2009 of Denmark. No data until 1970. Number of actual observations by date: 39.
Source name:
World Development Indicators
Source organization:
World Bank staff estimates from original source: European Commission, Joint Research Centre (JRC)/Netherlands Environmental Assessment Agency (PBL). Emission Database for Global Atmospheric Research (EDGAR): http://edgar.jrc.ec.europa.eu/.
Categories, topics:
Agriculture & Rural Development, Environment
Last updated:
apr 23, 2017
Indicators value changes by year
Maximum:
80.467
jan 1, 2006
At the date of observation
Value
Absolute change
Change from previous value
jan 1, 1971
58.14
+58.14
0.0%
jan 1, 1972
58.505
+0.365
0.63%
jan 1, 1973
65.357
+6.853
11.71%
jan 1, 1974
64.333
-1.024
-1.57%
jan 1, 1975
53.71
-10.623
-16.51%
jan 1, 1976
59.11
+5.4
10.05%
jan 1, 1977
72.088
+12.978
21.96%
jan 1, 1978
60.704
-11.384
-15.79%
jan 1, 1979
63.199
+2.495
4.11%
jan 1, 1980
67.363
+4.163
6.59%
jan 1, 1981
57.966
-9.397
-13.95%
jan 1, 1982
71.558
+13.592
23.45%
jan 1, 1983
65.297
-6.261
-8.75%
jan 1, 1984
55.668
-9.628
-14.75%
jan 1, 1985
72.603
+16.934
30.42%
jan 1, 1986
71.669
-0.934
-1.29%
jan 1, 1987
66.355
-5.314
-7.41%
jan 1, 1988
67.03
+0.675
1.02%
jan 1, 1989
69.894
+2.864
4.27%
jan 1, 1990
66.411
-3.483
-4.98%
jan 1, 1991
70.533
+4.122
6.21%
jan 1, 1992
69.752
-0.781
-1.11%
jan 1, 1993
70.265
+0.512
0.73%
jan 1, 1994
71.051
+0.786
1.12%
jan 1, 1995
69.966
-1.085
-1.53%
jan 1, 1996
69.253
-0.713
-1.02%
jan 1, 1997
68.489
-0.765
-1.1%
jan 1, 1998
69.285
+0.796
1.16%
jan 1, 1999
69.603
+0.318
0.46%
jan 1, 2000
67.275
-2.329
-3.35%
jan 1, 2001
68.371
+1.096
1.63%
jan 1, 2002
70.35
+1.979
2.89%
jan 1, 2003
70.869
+0.52
0.74%
jan 1, 2004
69.069
-1.801
-2.54%
jan 1, 2005
73.299
+4.23
6.12%
jan 1, 2006
80.467
+7.168
9.78%
jan 1, 2007
79.427
-1.039
-1.29%
jan 1, 2008
79.77
+0.342
0.43%
jan 1, 2009
79.836
+0.066
0.08%
Ranking of countries by current statistics by years


Comments: