29
/
en
AIzaSyAYiBZKx7MnpbEhh9jyipgxe19OcubqV5w
April 1, 2024
251616
St. Vincent and the Grenadines
VCT
true
2
1
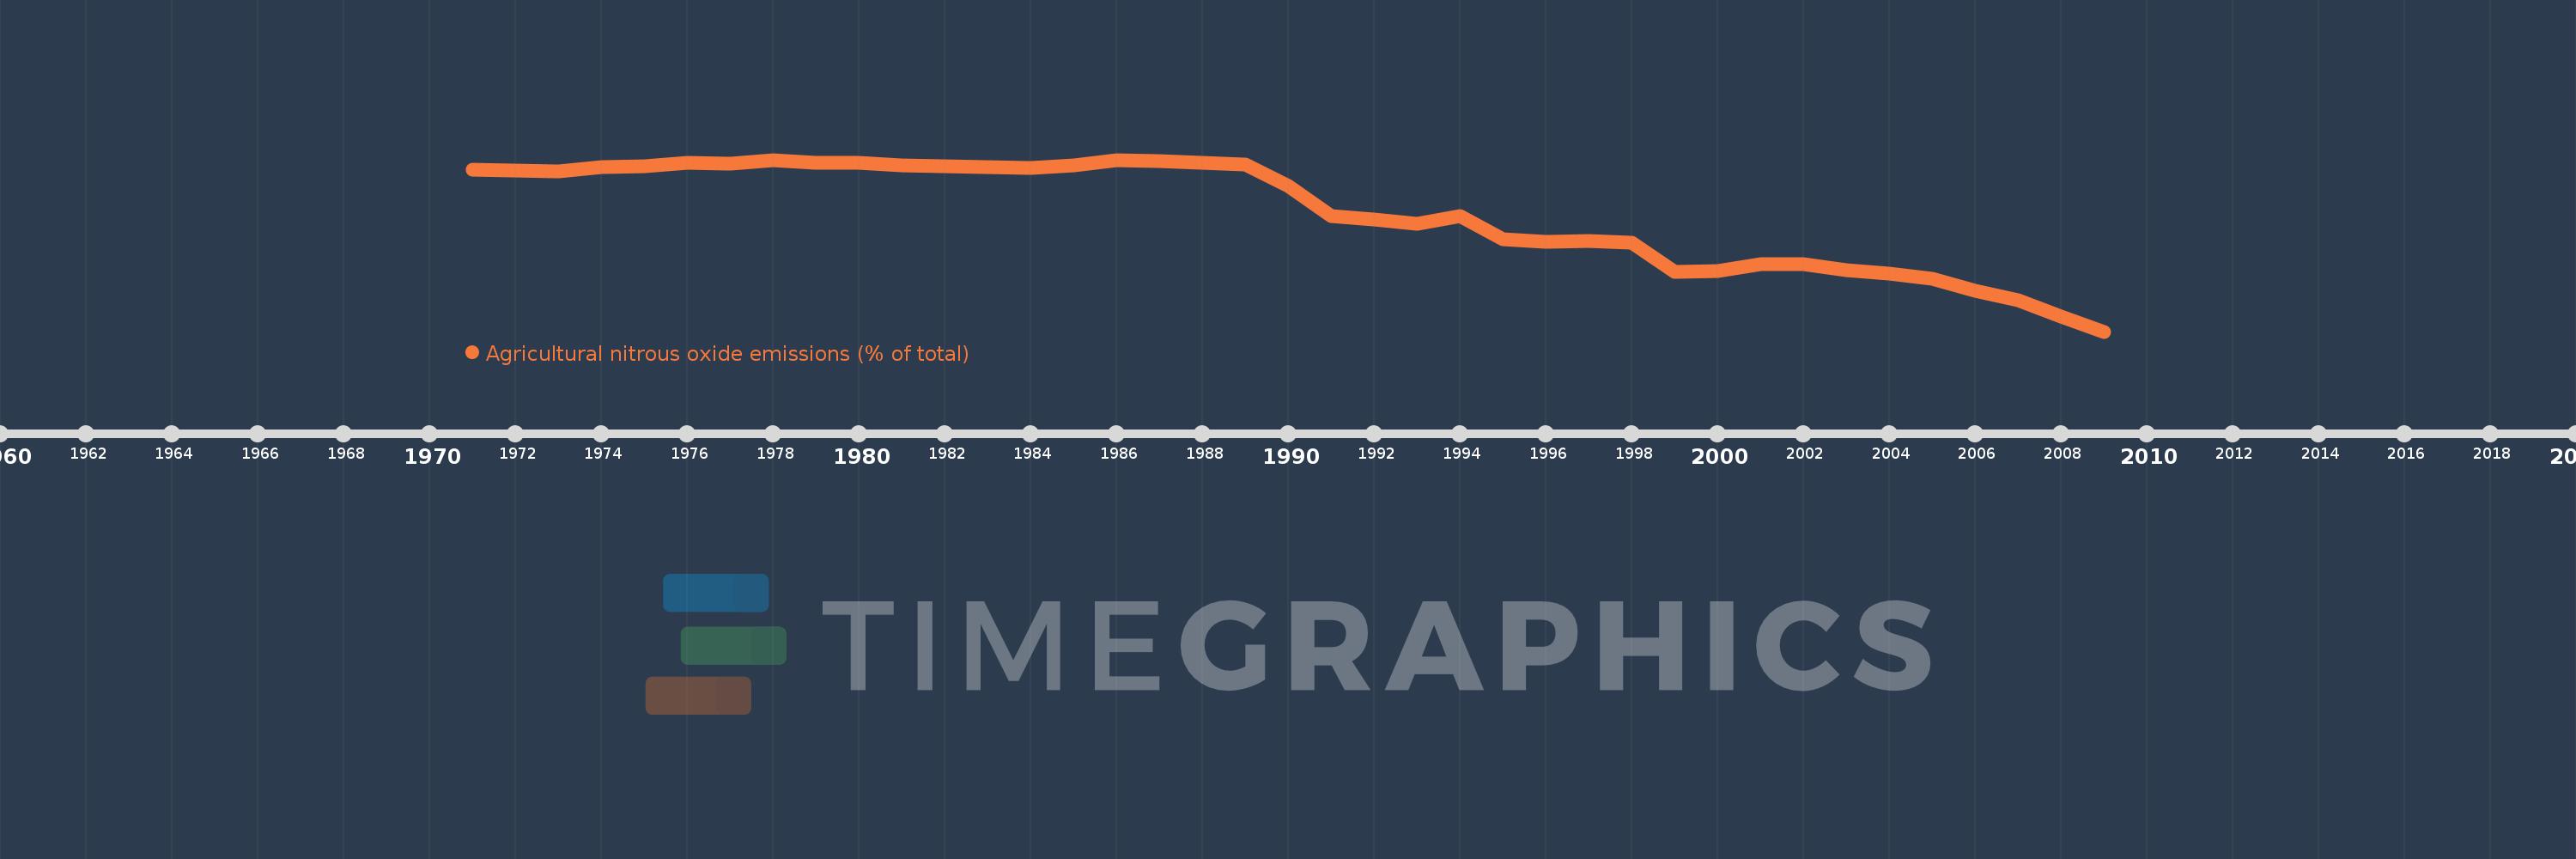
Agricultural nitrous oxide emissions (% of total)
2009,2008,2007,2006,2005,2004,2003,2002,2001,2000,1999,1998,1997,1996,1995,1994,1993,1992,1991,1990,1989,1988,1987,1986,1985,1984,1983,1982,1981,1980,1979,1978,1977,1976,1975,1974,1973,1972,1971
This statistics in other country:
AfghanistanAlbaniaAlgeriaAmerican SamoaAndorraAngolaAntigua and BarbudaArab WorldArgentinaArmeniaArubaAustraliaAustriaAzerbaijanBahamas, TheBahrainBangladeshBarbadosBelarusBelgiumBelizeBeninBermudaBhutanBoliviaBosnia and HerzegovinaBotswanaBrazilBritish Virgin IslandsBrunei DarussalamBulgariaBurkina FasoBurundiCabo VerdeCambodiaCameroonCanadaCaribbean small statesCayman IslandsCentral African RepublicCentral Europe and the BalticsChadChileChinaColombiaComorosCongo, Dem. Rep.Congo, Rep.Costa RicaCote d'IvoireCroatiaCubaCyprusCzech RepublicDenmarkDjiboutiDominicaDominican RepublicEarly-demographic dividendEast Asia & PacificEast Asia & Pacific (excluding high income)East Asia & Pacific (IDA & IBRD countries)EcuadorEgypt, Arab Rep.El SalvadorEquatorial GuineaEritreaEstoniaEthiopiaEuro areaEurope & Central AsiaEurope & Central Asia (excluding high income)Europe & Central Asia (IDA & IBRD countries)European UnionFaroe IslandsFijiFinlandFragile and conflict affected situationsFranceFrench PolynesiaGabonGambia, TheGeorgiaGermanyGhanaGibraltarGreeceGreenlandGrenadaGuamGuatemalaGuineaGuinea-BissauGuyanaHaitiHeavily indebted poor countries (HIPC)High incomeHondurasHong Kong SAR, ChinaHungaryIBRD onlyIcelandIDA & IBRD totalIDA blendIDA onlyIDA totalIndiaIndonesiaIran, Islamic Rep.IraqIrelandIsraelItalyJamaicaJapanJordanKazakhstanKenyaKiribatiKorea, Dem. People’s Rep.Korea, Rep.KuwaitKyrgyz RepublicLao PDRLate-demographic dividendLatin America & Caribbean Latin America & Caribbean (excluding high income)Latin America & the Caribbean (IDA & IBRD countries)LatviaLeast developed countries: UN classificationLebanonLesothoLiberiaLibyaLithuaniaLow & middle incomeLow incomeLower middle incomeLuxembourgMacao SAR, ChinaMacedonia, FYRMadagascarMalawiMalaysiaMaldivesMaliMaltaMarshall IslandsMauritaniaMauritiusMexicoMicronesia, Fed. Sts.Middle East & North AfricaMiddle East & North Africa (excluding high income)Middle East & North Africa (IDA & IBRD countries)Middle incomeMoldovaMongoliaMoroccoMozambiqueMyanmarNamibiaNauruNepalNetherlandsNew CaledoniaNew ZealandNicaraguaNigerNigeriaNorth AmericaNorthern Mariana IslandsNorwayOECD membersOmanOther small statesPacific island small statesPakistanPalauPanamaPapua New GuineaParaguayPeruPhilippinesPolandPortugalPost-demographic dividendPre-demographic dividendPuerto RicoQatarRomaniaRussian FederationRwandaSamoaSao Tome and PrincipeSaudi ArabiaSenegalSerbiaSeychellesSierra LeoneSingaporeSlovak RepublicSloveniaSmall statesSolomon IslandsSomaliaSouth AfricaSouth AsiaSouth Asia (IDA & IBRD)SpainSri LankaSt. Kitts and NevisSt. LuciaSt. Vincent and the GrenadinesSub-Saharan Africa Sub-Saharan Africa (excluding high income)Sub-Saharan Africa (IDA & IBRD countries)SudanSurinameSwazilandSwedenSwitzerlandSyrian Arab RepublicTajikistanTanzaniaThailandTimor-LesteTogoTongaTrinidad and TobagoTunisiaTurkeyTurkmenistanTurks and Caicos IslandsTuvaluUgandaUkraineUnited Arab EmiratesUnited KingdomUnited StatesUpper middle incomeUruguayUzbekistanVanuatuVenezuela, RBVietnamVirgin Islands (U.S.)WorldYemen, Rep.ZambiaZimbabwe Timeline:
This timeline shows a graph from 1971 to 2009 of St. Vincent and the Grenadines. No data until 1970. Number of actual observations by date: 39.
Source name:
World Development Indicators
Source organization:
World Bank staff estimates from original source: European Commission, Joint Research Centre (JRC)/Netherlands Environmental Assessment Agency (PBL). Emission Database for Global Atmospheric Research (EDGAR): http://edgar.jrc.ec.europa.eu/.
Categories, topics:
Agriculture & Rural Development, Environment
Last updated:
apr 23, 2017
Indicators value changes by year
Minimum:
47.914
jan 1, 2009
Maximum:
89.402
jan 1, 1978
At the date of observation
Value
Absolute change
Change from previous value
jan 1, 1971
86.938
+86.938
0.0%
jan 1, 1972
86.823
-0.116
-0.13%
jan 1, 1973
86.661
-0.162
-0.19%
jan 1, 1974
87.723
+1.062
1.23%
jan 1, 1975
87.758
+0.036
0.04%
jan 1, 1976
88.666
+0.908
1.03%
jan 1, 1977
88.49
-0.176
-0.2%
jan 1, 1978
89.402
+0.912
1.03%
jan 1, 1979
88.779
-0.623
-0.7%
jan 1, 1980
88.574
-0.205
-0.23%
jan 1, 1981
88.056
-0.518
-0.58%
jan 1, 1982
87.774
-0.282
-0.32%
jan 1, 1983
87.648
-0.126
-0.14%
jan 1, 1984
87.469
-0.179
-0.2%
jan 1, 1985
88.038
+0.568
0.65%
jan 1, 1986
89.23
+1.192
1.35%
jan 1, 1987
89.176
-0.054
-0.06%
jan 1, 1988
88.63
-0.547
-0.61%
jan 1, 1989
88.341
-0.288
-0.33%
jan 1, 1990
83.011
-5.331
-6.03%
jan 1, 1991
75.829
-7.181
-8.65%
jan 1, 1992
74.976
-0.853
-1.12%
jan 1, 1993
74.033
-0.943
-1.26%
jan 1, 1994
75.802
+1.769
2.39%
jan 1, 1995
70.311
-5.491
-7.24%
jan 1, 1996
69.521
-0.79
-1.12%
jan 1, 1997
69.712
+0.191
0.27%
jan 1, 1998
69.467
-0.246
-0.35%
jan 1, 1999
62.23
-7.237
-10.42%
jan 1, 2000
62.443
+0.213
0.34%
jan 1, 2001
64.24
+1.798
2.88%
jan 1, 2002
64.261
+0.021
0.03%
jan 1, 2003
62.75
-1.512
-2.35%
jan 1, 2004
61.932
-0.818
-1.3%
jan 1, 2005
60.72
-1.212
-1.96%
jan 1, 2006
57.867
-2.853
-4.7%
jan 1, 2007
55.524
-2.343
-4.05%
jan 1, 2008
51.572
-3.952
-7.12%
jan 1, 2009
47.914
-3.658
-7.09%
Ranking of countries by current statistics by years


Comments: