29
/
en
AIzaSyAYiBZKx7MnpbEhh9jyipgxe19OcubqV5w
April 1, 2024
247268
Spain
ESP
true
2
1
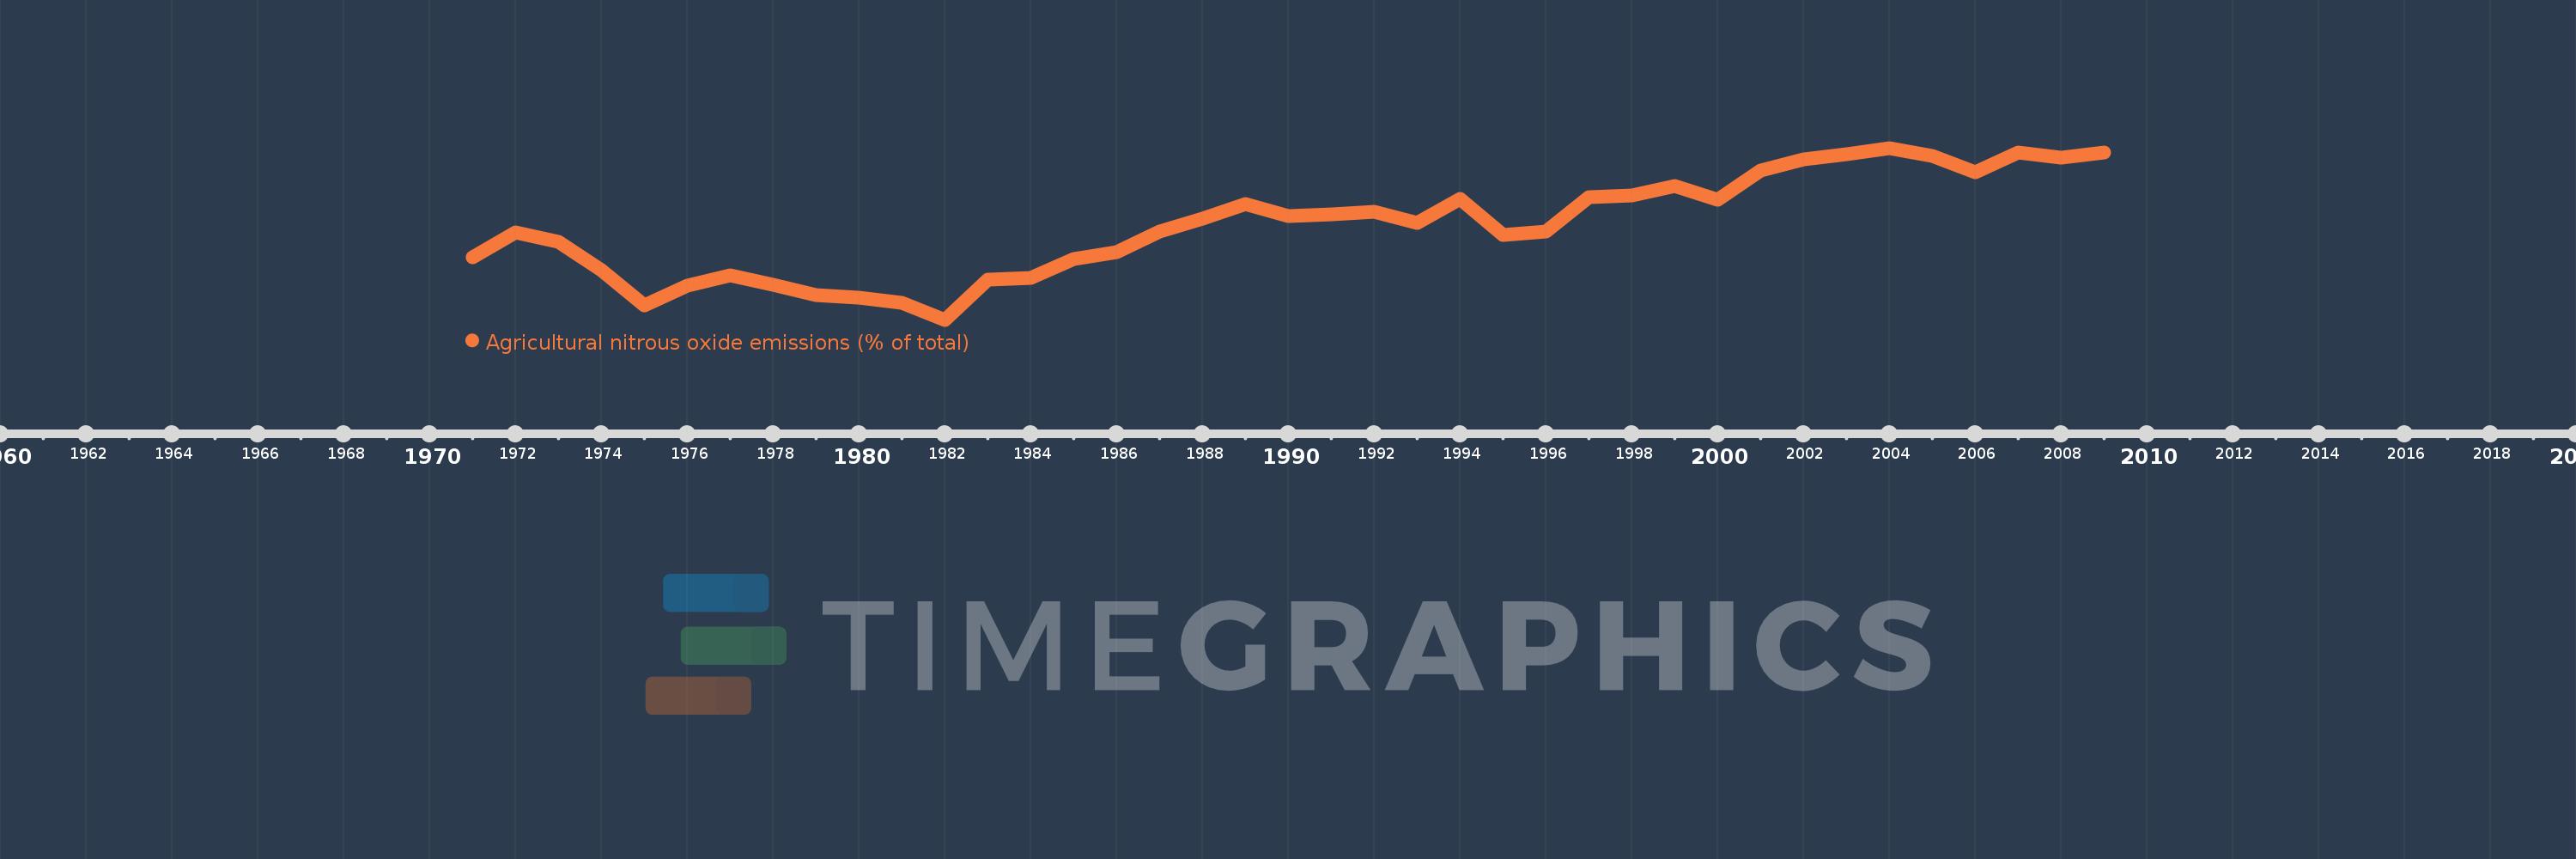
Agricultural nitrous oxide emissions (% of total)
2009,2008,2007,2006,2005,2004,2003,2002,2001,2000,1999,1998,1997,1996,1995,1994,1993,1992,1991,1990,1989,1988,1987,1986,1985,1984,1983,1982,1981,1980,1979,1978,1977,1976,1975,1974,1973,1972,1971
This statistics in other country:
AfghanistanAlbaniaAlgeriaAmerican SamoaAndorraAngolaAntigua and BarbudaArab WorldArgentinaArmeniaArubaAustraliaAustriaAzerbaijanBahamas, TheBahrainBangladeshBarbadosBelarusBelgiumBelizeBeninBermudaBhutanBoliviaBosnia and HerzegovinaBotswanaBrazilBritish Virgin IslandsBrunei DarussalamBulgariaBurkina FasoBurundiCabo VerdeCambodiaCameroonCanadaCaribbean small statesCayman IslandsCentral African RepublicCentral Europe and the BalticsChadChileChinaColombiaComorosCongo, Dem. Rep.Congo, Rep.Costa RicaCote d'IvoireCroatiaCubaCyprusCzech RepublicDenmarkDjiboutiDominicaDominican RepublicEarly-demographic dividendEast Asia & PacificEast Asia & Pacific (excluding high income)East Asia & Pacific (IDA & IBRD countries)EcuadorEgypt, Arab Rep.El SalvadorEquatorial GuineaEritreaEstoniaEthiopiaEuro areaEurope & Central AsiaEurope & Central Asia (excluding high income)Europe & Central Asia (IDA & IBRD countries)European UnionFaroe IslandsFijiFinlandFragile and conflict affected situationsFranceFrench PolynesiaGabonGambia, TheGeorgiaGermanyGhanaGibraltarGreeceGreenlandGrenadaGuamGuatemalaGuineaGuinea-BissauGuyanaHaitiHeavily indebted poor countries (HIPC)High incomeHondurasHong Kong SAR, ChinaHungaryIBRD onlyIcelandIDA & IBRD totalIDA blendIDA onlyIDA totalIndiaIndonesiaIran, Islamic Rep.IraqIrelandIsraelItalyJamaicaJapanJordanKazakhstanKenyaKiribatiKorea, Dem. People’s Rep.Korea, Rep.KuwaitKyrgyz RepublicLao PDRLate-demographic dividendLatin America & Caribbean Latin America & Caribbean (excluding high income)Latin America & the Caribbean (IDA & IBRD countries)LatviaLeast developed countries: UN classificationLebanonLesothoLiberiaLibyaLithuaniaLow & middle incomeLow incomeLower middle incomeLuxembourgMacao SAR, ChinaMacedonia, FYRMadagascarMalawiMalaysiaMaldivesMaliMaltaMarshall IslandsMauritaniaMauritiusMexicoMicronesia, Fed. Sts.Middle East & North AfricaMiddle East & North Africa (excluding high income)Middle East & North Africa (IDA & IBRD countries)Middle incomeMoldovaMongoliaMoroccoMozambiqueMyanmarNamibiaNauruNepalNetherlandsNew CaledoniaNew ZealandNicaraguaNigerNigeriaNorth AmericaNorthern Mariana IslandsNorwayOECD membersOmanOther small statesPacific island small statesPakistanPalauPanamaPapua New GuineaParaguayPeruPhilippinesPolandPortugalPost-demographic dividendPre-demographic dividendPuerto RicoQatarRomaniaRussian FederationRwandaSamoaSao Tome and PrincipeSaudi ArabiaSenegalSerbiaSeychellesSierra LeoneSingaporeSlovak RepublicSloveniaSmall statesSolomon IslandsSomaliaSouth AfricaSouth AsiaSouth Asia (IDA & IBRD)SpainSri LankaSt. Kitts and NevisSt. LuciaSt. Vincent and the GrenadinesSub-Saharan Africa Sub-Saharan Africa (excluding high income)Sub-Saharan Africa (IDA & IBRD countries)SudanSurinameSwazilandSwedenSwitzerlandSyrian Arab RepublicTajikistanTanzaniaThailandTimor-LesteTogoTongaTrinidad and TobagoTunisiaTurkeyTurkmenistanTurks and Caicos IslandsTuvaluUgandaUkraineUnited Arab EmiratesUnited KingdomUnited StatesUpper middle incomeUruguayUzbekistanVanuatuVenezuela, RBVietnamVirgin Islands (U.S.)WorldYemen, Rep.ZambiaZimbabwe Timeline:
This timeline shows a graph from 1971 to 2009 of Spain. No data until 1970. Number of actual observations by date: 39.
Source name:
World Development Indicators
Source organization:
World Bank staff estimates from original source: European Commission, Joint Research Centre (JRC)/Netherlands Environmental Assessment Agency (PBL). Emission Database for Global Atmospheric Research (EDGAR): http://edgar.jrc.ec.europa.eu/.
Categories, topics:
Agriculture & Rural Development, Environment
Last updated:
apr 23, 2017
Indicators value changes by year
Minimum:
48.532
jan 1, 1982
Maximum:
65.983
jan 1, 2004
At the date of observation
Value
Absolute change
Change from previous value
jan 1, 1971
54.849
+54.849
0.0%
jan 1, 1972
57.378
+2.529
4.61%
jan 1, 1973
56.453
-0.925
-1.61%
jan 1, 1974
53.559
-2.895
-5.13%
jan 1, 1975
50.026
-3.532
-6.6%
jan 1, 1976
51.964
+1.937
3.87%
jan 1, 1977
53.071
+1.107
2.13%
jan 1, 1978
52.056
-1.015
-1.91%
jan 1, 1979
51.03
-1.026
-1.97%
jan 1, 1980
50.812
-0.218
-0.43%
jan 1, 1981
50.25
-0.562
-1.11%
jan 1, 1982
48.532
-1.718
-3.42%
jan 1, 1983
52.565
+4.034
8.31%
jan 1, 1984
52.781
+0.216
0.41%
jan 1, 1985
54.691
+1.909
3.62%
jan 1, 1986
55.383
+0.693
1.27%
jan 1, 1987
57.511
+2.127
3.84%
jan 1, 1988
58.842
+1.332
2.32%
jan 1, 1989
60.292
+1.45
2.46%
jan 1, 1990
59.078
-1.214
-2.01%
jan 1, 1991
59.278
+0.2
0.34%
jan 1, 1992
59.477
+0.198
0.33%
jan 1, 1993
58.353
-1.124
-1.89%
jan 1, 1994
60.852
+2.499
4.28%
jan 1, 1995
57.104
-3.747
-6.16%
jan 1, 1996
57.462
+0.358
0.63%
jan 1, 1997
60.965
+3.503
6.1%
jan 1, 1998
61.138
+0.173
0.28%
jan 1, 1999
62.087
+0.949
1.55%
jan 1, 2000
60.698
-1.389
-2.24%
jan 1, 2001
63.689
+2.991
4.93%
jan 1, 2002
64.839
+1.151
1.81%
jan 1, 2003
65.361
+0.521
0.8%
jan 1, 2004
65.983
+0.622
0.95%
jan 1, 2005
65.137
-0.846
-1.28%
jan 1, 2006
63.493
-1.644
-2.52%
jan 1, 2007
65.563
+2.07
3.26%
jan 1, 2008
65.015
-0.547
-0.83%
jan 1, 2009
65.504
+0.488
0.75%
Ranking of countries by current statistics by years


Comments: