29
/
en
AIzaSyAYiBZKx7MnpbEhh9jyipgxe19OcubqV5w
April 1, 2024
72692
Australia
AUS
true
2
1
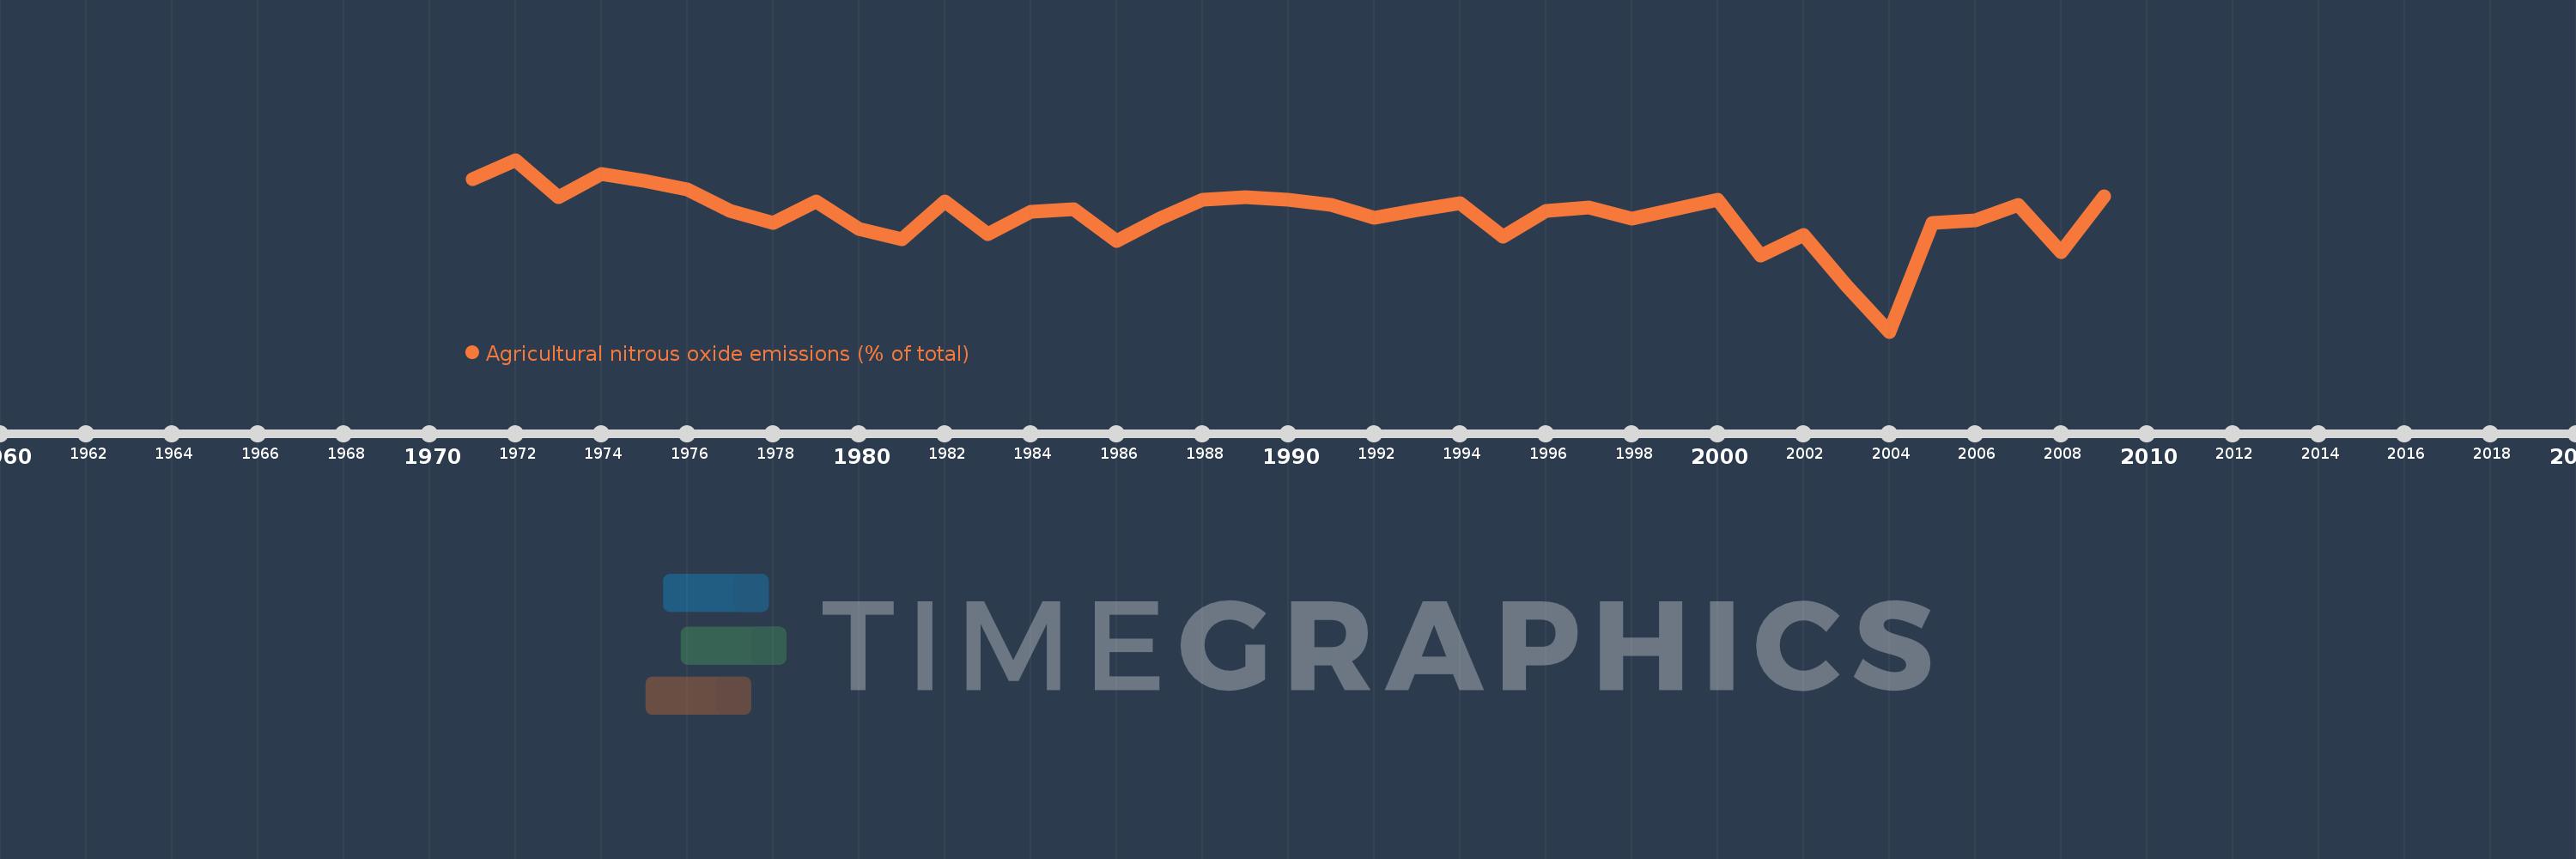
Agricultural nitrous oxide emissions (% of total)
2009,2008,2007,2006,2005,2004,2003,2002,2001,2000,1999,1998,1997,1996,1995,1994,1993,1992,1991,1990,1989,1988,1987,1986,1985,1984,1983,1982,1981,1980,1979,1978,1977,1976,1975,1974,1973,1972,1971
This statistics in other country:
AfghanistanAlbaniaAlgeriaAmerican SamoaAndorraAngolaAntigua and BarbudaArab WorldArgentinaArmeniaArubaAustraliaAustriaAzerbaijanBahamas, TheBahrainBangladeshBarbadosBelarusBelgiumBelizeBeninBermudaBhutanBoliviaBosnia and HerzegovinaBotswanaBrazilBritish Virgin IslandsBrunei DarussalamBulgariaBurkina FasoBurundiCabo VerdeCambodiaCameroonCanadaCaribbean small statesCayman IslandsCentral African RepublicCentral Europe and the BalticsChadChileChinaColombiaComorosCongo, Dem. Rep.Congo, Rep.Costa RicaCote d'IvoireCroatiaCubaCyprusCzech RepublicDenmarkDjiboutiDominicaDominican RepublicEarly-demographic dividendEast Asia & PacificEast Asia & Pacific (excluding high income)East Asia & Pacific (IDA & IBRD countries)EcuadorEgypt, Arab Rep.El SalvadorEquatorial GuineaEritreaEstoniaEthiopiaEuro areaEurope & Central AsiaEurope & Central Asia (excluding high income)Europe & Central Asia (IDA & IBRD countries)European UnionFaroe IslandsFijiFinlandFragile and conflict affected situationsFranceFrench PolynesiaGabonGambia, TheGeorgiaGermanyGhanaGibraltarGreeceGreenlandGrenadaGuamGuatemalaGuineaGuinea-BissauGuyanaHaitiHeavily indebted poor countries (HIPC)High incomeHondurasHong Kong SAR, ChinaHungaryIBRD onlyIcelandIDA & IBRD totalIDA blendIDA onlyIDA totalIndiaIndonesiaIran, Islamic Rep.IraqIrelandIsraelItalyJamaicaJapanJordanKazakhstanKenyaKiribatiKorea, Dem. People’s Rep.Korea, Rep.KuwaitKyrgyz RepublicLao PDRLate-demographic dividendLatin America & Caribbean Latin America & Caribbean (excluding high income)Latin America & the Caribbean (IDA & IBRD countries)LatviaLeast developed countries: UN classificationLebanonLesothoLiberiaLibyaLithuaniaLow & middle incomeLow incomeLower middle incomeLuxembourgMacao SAR, ChinaMacedonia, FYRMadagascarMalawiMalaysiaMaldivesMaliMaltaMarshall IslandsMauritaniaMauritiusMexicoMicronesia, Fed. Sts.Middle East & North AfricaMiddle East & North Africa (excluding high income)Middle East & North Africa (IDA & IBRD countries)Middle incomeMoldovaMongoliaMoroccoMozambiqueMyanmarNamibiaNauruNepalNetherlandsNew CaledoniaNew ZealandNicaraguaNigerNigeriaNorth AmericaNorthern Mariana IslandsNorwayOECD membersOmanOther small statesPacific island small statesPakistanPalauPanamaPapua New GuineaParaguayPeruPhilippinesPolandPortugalPost-demographic dividendPre-demographic dividendPuerto RicoQatarRomaniaRussian FederationRwandaSamoaSao Tome and PrincipeSaudi ArabiaSenegalSerbiaSeychellesSierra LeoneSingaporeSlovak RepublicSloveniaSmall statesSolomon IslandsSomaliaSouth AfricaSouth AsiaSouth Asia (IDA & IBRD)SpainSri LankaSt. Kitts and NevisSt. LuciaSt. Vincent and the GrenadinesSub-Saharan Africa Sub-Saharan Africa (excluding high income)Sub-Saharan Africa (IDA & IBRD countries)SudanSurinameSwazilandSwedenSwitzerlandSyrian Arab RepublicTajikistanTanzaniaThailandTimor-LesteTogoTongaTrinidad and TobagoTunisiaTurkeyTurkmenistanTurks and Caicos IslandsTuvaluUgandaUkraineUnited Arab EmiratesUnited KingdomUnited StatesUpper middle incomeUruguayUzbekistanVanuatuVenezuela, RBVietnamVirgin Islands (U.S.)WorldYemen, Rep.ZambiaZimbabwe Timeline:
This timeline shows a graph from 1971 to 2009 of Australia. No data until 1970. Number of actual observations by date: 39.
Source name:
World Development Indicators
Source organization:
World Bank staff estimates from original source: European Commission, Joint Research Centre (JRC)/Netherlands Environmental Assessment Agency (PBL). Emission Database for Global Atmospheric Research (EDGAR): http://edgar.jrc.ec.europa.eu/.
Categories, topics:
Agriculture & Rural Development, Environment
Last updated:
apr 23, 2017
Indicators value changes by year
Minimum:
66.948
jan 1, 2004
Maximum:
84.795
jan 1, 1972
At the date of observation
Value
Absolute change
Change from previous value
jan 1, 1971
82.825
+82.825
0.0%
jan 1, 1972
84.795
+1.971
2.38%
jan 1, 1973
80.89
-3.906
-4.61%
jan 1, 1974
83.302
+2.412
2.98%
jan 1, 1975
82.581
-0.721
-0.87%
jan 1, 1976
81.687
-0.894
-1.08%
jan 1, 1977
79.448
-2.239
-2.74%
jan 1, 1978
78.242
-1.206
-1.52%
jan 1, 1979
80.447
+2.205
2.82%
jan 1, 1980
77.597
-2.85
-3.54%
jan 1, 1981
76.507
-1.09
-1.4%
jan 1, 1982
80.502
+3.995
5.22%
jan 1, 1983
77.037
-3.466
-4.31%
jan 1, 1984
79.412
+2.376
3.08%
jan 1, 1985
79.643
+0.231
0.29%
jan 1, 1986
76.318
-3.325
-4.18%
jan 1, 1987
78.639
+2.321
3.04%
jan 1, 1988
80.644
+2.005
2.55%
jan 1, 1989
80.894
+0.25
0.31%
jan 1, 1990
80.606
-0.288
-0.36%
jan 1, 1991
80.101
-0.505
-0.63%
jan 1, 1992
78.755
-1.346
-1.68%
jan 1, 1993
79.587
+0.832
1.06%
jan 1, 1994
80.276
+0.689
0.87%
jan 1, 1995
76.785
-3.491
-4.35%
jan 1, 1996
79.501
+2.716
3.54%
jan 1, 1997
79.853
+0.352
0.44%
jan 1, 1998
78.654
-1.199
-1.5%
jan 1, 1999
79.646
+0.992
1.26%
jan 1, 2000
80.603
+0.957
1.2%
jan 1, 2001
74.874
-5.728
-7.11%
jan 1, 2002
76.971
+2.097
2.8%
jan 1, 2003
71.711
-5.26
-6.83%
jan 1, 2004
66.948
-4.763
-6.64%
jan 1, 2005
78.239
+11.291
16.87%
jan 1, 2006
78.517
+0.278
0.36%
jan 1, 2007
80.108
+1.591
2.03%
jan 1, 2008
75.219
-4.889
-6.1%
jan 1, 2009
81.045
+5.826
7.75%
Ranking of countries by current statistics by years


Comments: