29
/
en
AIzaSyAYiBZKx7MnpbEhh9jyipgxe19OcubqV5w
April 1, 2024
131688
Fiji
FJI
true
2
1
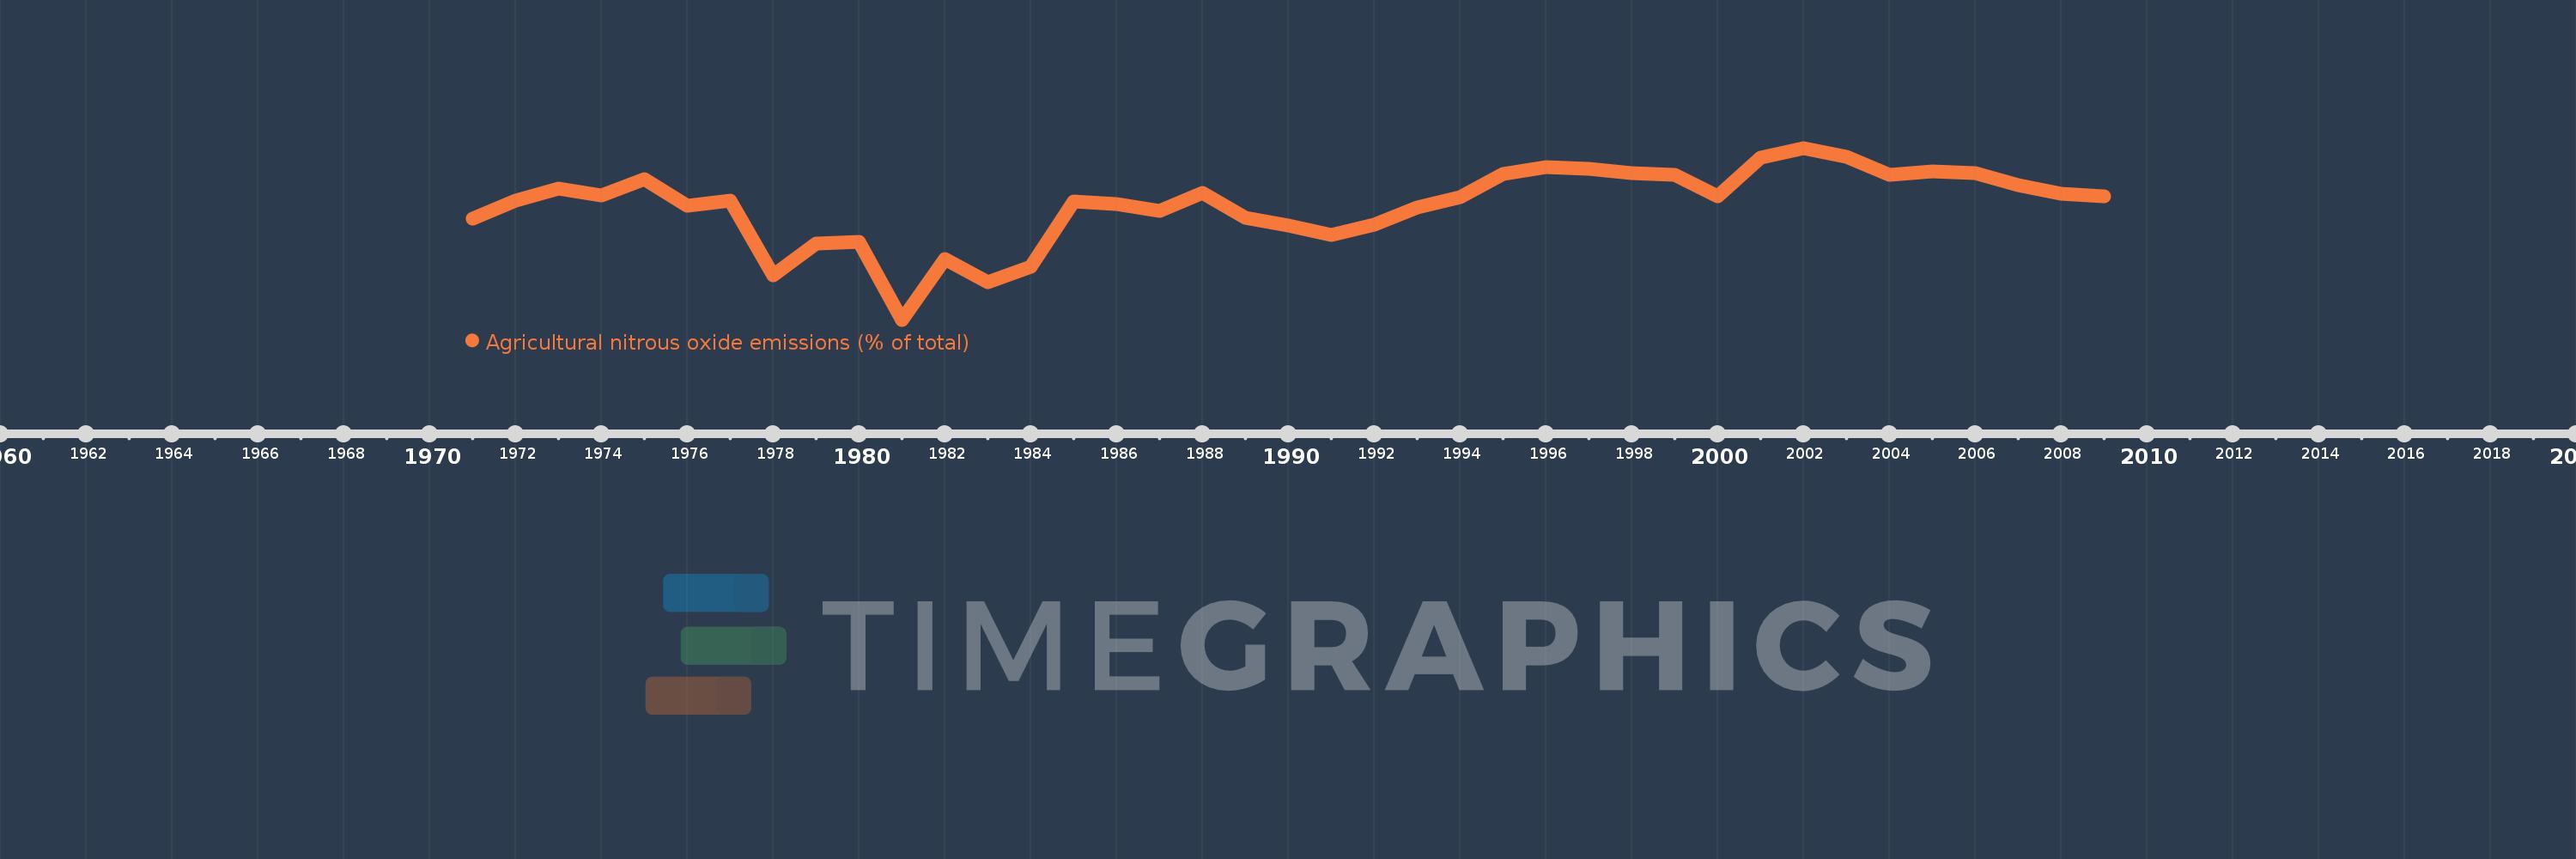
Agricultural nitrous oxide emissions (% of total)
2009,2008,2007,2006,2005,2004,2003,2002,2001,2000,1999,1998,1997,1996,1995,1994,1993,1992,1991,1990,1989,1988,1987,1986,1985,1984,1983,1982,1981,1980,1979,1978,1977,1976,1975,1974,1973,1972,1971
This statistics in other country:
AfghanistanAlbaniaAlgeriaAmerican SamoaAndorraAngolaAntigua and BarbudaArab WorldArgentinaArmeniaArubaAustraliaAustriaAzerbaijanBahamas, TheBahrainBangladeshBarbadosBelarusBelgiumBelizeBeninBermudaBhutanBoliviaBosnia and HerzegovinaBotswanaBrazilBritish Virgin IslandsBrunei DarussalamBulgariaBurkina FasoBurundiCabo VerdeCambodiaCameroonCanadaCaribbean small statesCayman IslandsCentral African RepublicCentral Europe and the BalticsChadChileChinaColombiaComorosCongo, Dem. Rep.Congo, Rep.Costa RicaCote d'IvoireCroatiaCubaCyprusCzech RepublicDenmarkDjiboutiDominicaDominican RepublicEarly-demographic dividendEast Asia & PacificEast Asia & Pacific (excluding high income)East Asia & Pacific (IDA & IBRD countries)EcuadorEgypt, Arab Rep.El SalvadorEquatorial GuineaEritreaEstoniaEthiopiaEuro areaEurope & Central AsiaEurope & Central Asia (excluding high income)Europe & Central Asia (IDA & IBRD countries)European UnionFaroe IslandsFijiFinlandFragile and conflict affected situationsFranceFrench PolynesiaGabonGambia, TheGeorgiaGermanyGhanaGibraltarGreeceGreenlandGrenadaGuamGuatemalaGuineaGuinea-BissauGuyanaHaitiHeavily indebted poor countries (HIPC)High incomeHondurasHong Kong SAR, ChinaHungaryIBRD onlyIcelandIDA & IBRD totalIDA blendIDA onlyIDA totalIndiaIndonesiaIran, Islamic Rep.IraqIrelandIsraelItalyJamaicaJapanJordanKazakhstanKenyaKiribatiKorea, Dem. People’s Rep.Korea, Rep.KuwaitKyrgyz RepublicLao PDRLate-demographic dividendLatin America & Caribbean Latin America & Caribbean (excluding high income)Latin America & the Caribbean (IDA & IBRD countries)LatviaLeast developed countries: UN classificationLebanonLesothoLiberiaLibyaLithuaniaLow & middle incomeLow incomeLower middle incomeLuxembourgMacao SAR, ChinaMacedonia, FYRMadagascarMalawiMalaysiaMaldivesMaliMaltaMarshall IslandsMauritaniaMauritiusMexicoMicronesia, Fed. Sts.Middle East & North AfricaMiddle East & North Africa (excluding high income)Middle East & North Africa (IDA & IBRD countries)Middle incomeMoldovaMongoliaMoroccoMozambiqueMyanmarNamibiaNauruNepalNetherlandsNew CaledoniaNew ZealandNicaraguaNigerNigeriaNorth AmericaNorthern Mariana IslandsNorwayOECD membersOmanOther small statesPacific island small statesPakistanPalauPanamaPapua New GuineaParaguayPeruPhilippinesPolandPortugalPost-demographic dividendPre-demographic dividendPuerto RicoQatarRomaniaRussian FederationRwandaSamoaSao Tome and PrincipeSaudi ArabiaSenegalSerbiaSeychellesSierra LeoneSingaporeSlovak RepublicSloveniaSmall statesSolomon IslandsSomaliaSouth AfricaSouth AsiaSouth Asia (IDA & IBRD)SpainSri LankaSt. Kitts and NevisSt. LuciaSt. Vincent and the GrenadinesSub-Saharan Africa Sub-Saharan Africa (excluding high income)Sub-Saharan Africa (IDA & IBRD countries)SudanSurinameSwazilandSwedenSwitzerlandSyrian Arab RepublicTajikistanTanzaniaThailandTimor-LesteTogoTongaTrinidad and TobagoTunisiaTurkeyTurkmenistanTurks and Caicos IslandsTuvaluUgandaUkraineUnited Arab EmiratesUnited KingdomUnited StatesUpper middle incomeUruguayUzbekistanVanuatuVenezuela, RBVietnamVirgin Islands (U.S.)WorldYemen, Rep.ZambiaZimbabwe Timeline:
This timeline shows a graph from 1971 to 2009 of Fiji. No data until 1970. Number of actual observations by date: 39.
Source name:
World Development Indicators
Source organization:
World Bank staff estimates from original source: European Commission, Joint Research Centre (JRC)/Netherlands Environmental Assessment Agency (PBL). Emission Database for Global Atmospheric Research (EDGAR): http://edgar.jrc.ec.europa.eu/.
Categories, topics:
Agriculture & Rural Development, Environment
Last updated:
apr 23, 2017
Indicators value changes by year
Minimum:
87.662
jan 1, 1981
Maximum:
92.883
jan 1, 2002
At the date of observation
Value
Absolute change
Change from previous value
jan 1, 1971
90.744
+90.744
0.0%
jan 1, 1972
91.275
+0.531
0.58%
jan 1, 1973
91.64
+0.365
0.4%
jan 1, 1974
91.447
-0.193
-0.21%
jan 1, 1975
91.924
+0.477
0.52%
jan 1, 1976
91.137
-0.787
-0.86%
jan 1, 1977
91.282
+0.145
0.16%
jan 1, 1978
89.013
-2.269
-2.49%
jan 1, 1979
89.983
+0.969
1.09%
jan 1, 1980
90.041
+0.059
0.07%
jan 1, 1981
87.662
-2.379
-2.64%
jan 1, 1982
89.51
+1.848
2.11%
jan 1, 1983
88.81
-0.701
-0.78%
jan 1, 1984
89.27
+0.46
0.52%
jan 1, 1985
91.244
+1.975
2.21%
jan 1, 1986
91.171
-0.073
-0.08%
jan 1, 1987
90.973
-0.198
-0.22%
jan 1, 1988
91.529
+0.556
0.61%
jan 1, 1989
90.771
-0.758
-0.83%
jan 1, 1990
90.535
-0.236
-0.26%
jan 1, 1991
90.246
-0.29
-0.32%
jan 1, 1992
90.559
+0.313
0.35%
jan 1, 1993
91.082
+0.523
0.58%
jan 1, 1994
91.377
+0.296
0.32%
jan 1, 1995
92.101
+0.724
0.79%
jan 1, 1996
92.294
+0.193
0.21%
jan 1, 1997
92.247
-0.047
-0.05%
jan 1, 1998
92.127
-0.12
-0.13%
jan 1, 1999
92.075
-0.052
-0.06%
jan 1, 2000
91.423
-0.652
-0.71%
jan 1, 2001
92.581
+1.159
1.27%
jan 1, 2002
92.883
+0.301
0.33%
jan 1, 2003
92.626
-0.256
-0.28%
jan 1, 2004
92.072
-0.555
-0.6%
jan 1, 2005
92.18
+0.108
0.12%
jan 1, 2006
92.117
-0.063
-0.07%
jan 1, 2007
91.748
-0.368
-0.4%
jan 1, 2008
91.491
-0.257
-0.28%
jan 1, 2009
91.418
-0.073
-0.08%
Ranking of countries by current statistics by years


Comments: