29
/
en
AIzaSyAYiBZKx7MnpbEhh9jyipgxe19OcubqV5w
April 1, 2024
44044
Least developed countries: UN classification
LDC
false
2
1
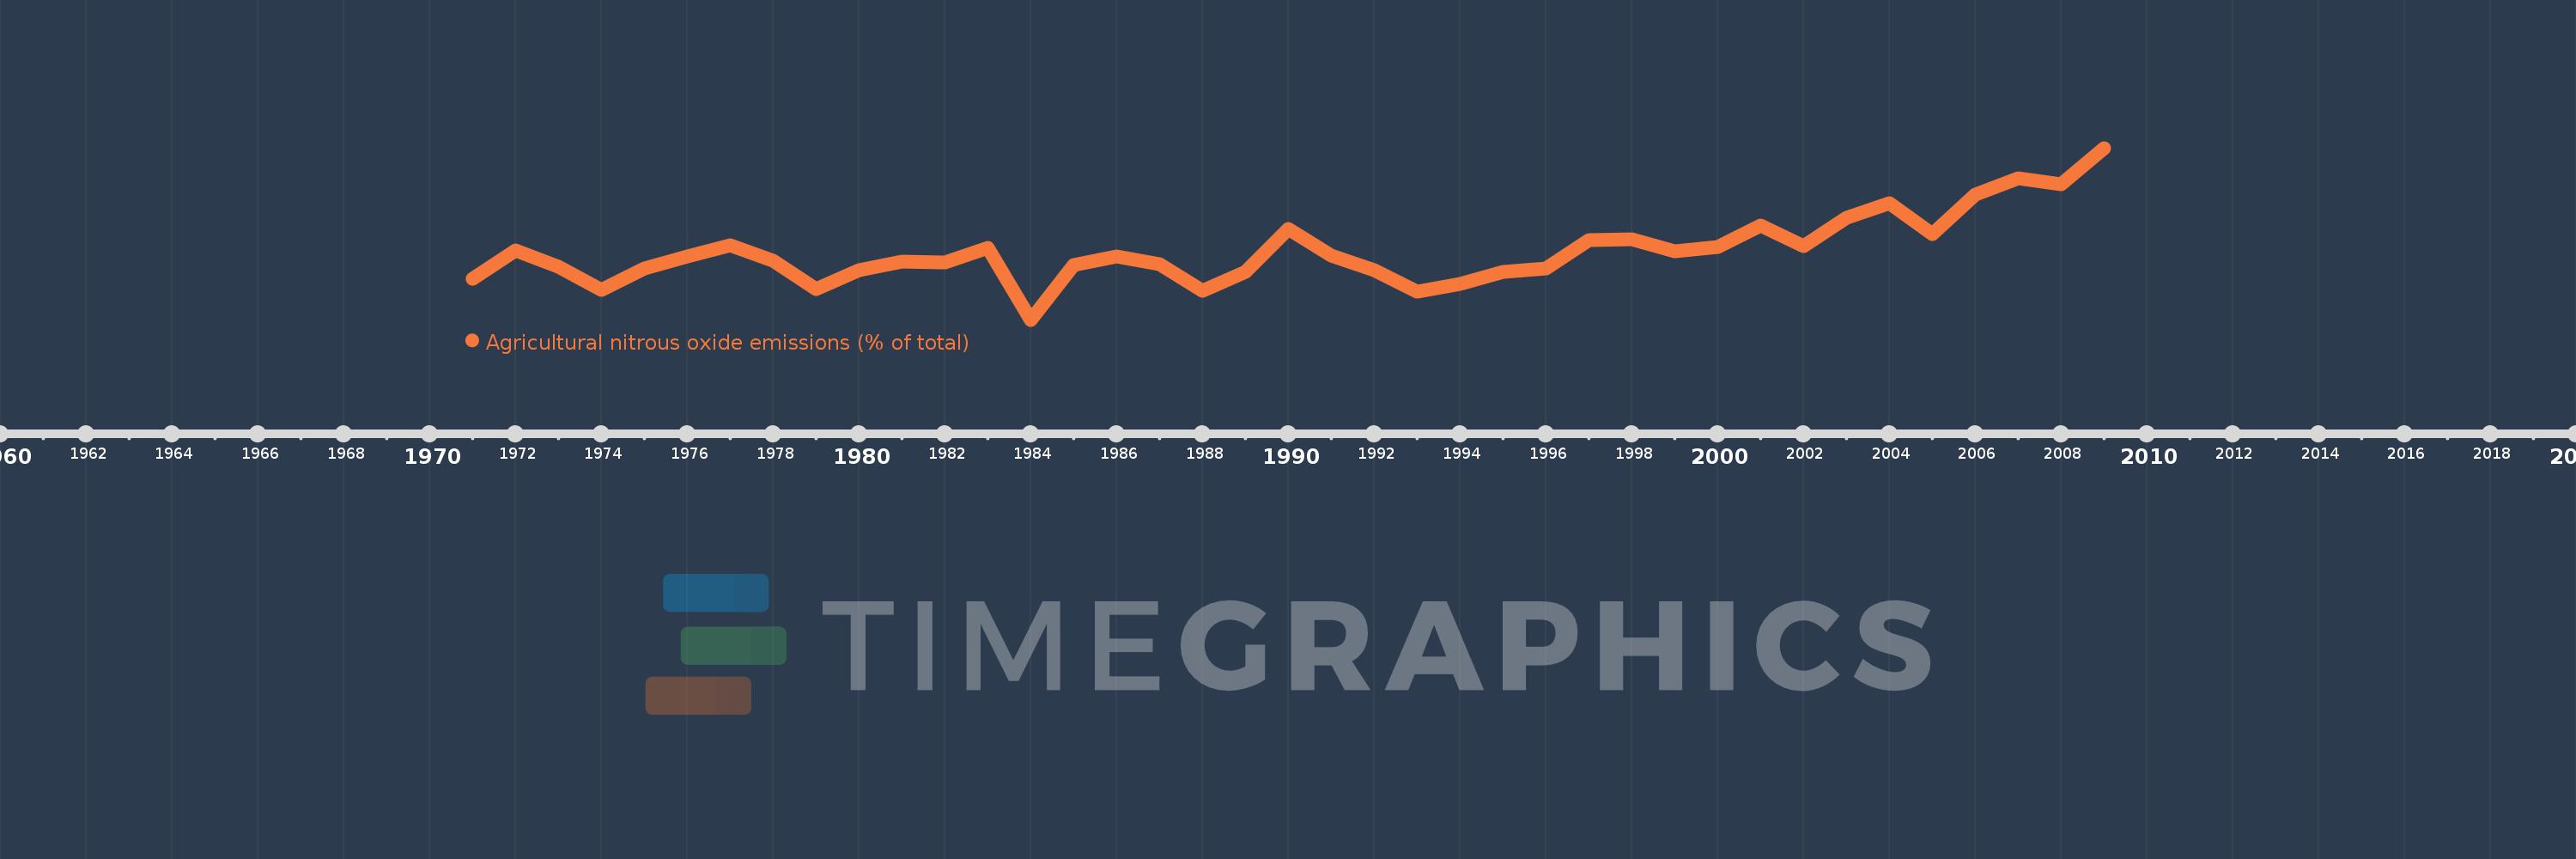
Agricultural nitrous oxide emissions (% of total)
2009,2008,2007,2006,2005,2004,2003,2002,2001,2000,1999,1998,1997,1996,1995,1994,1993,1992,1991,1990,1989,1988,1987,1986,1985,1984,1983,1982,1981,1980,1979,1978,1977,1976,1975,1974,1973,1972,1971
This statistics in other country:
AfghanistanAlbaniaAlgeriaAmerican SamoaAndorraAngolaAntigua and BarbudaArab WorldArgentinaArmeniaArubaAustraliaAustriaAzerbaijanBahamas, TheBahrainBangladeshBarbadosBelarusBelgiumBelizeBeninBermudaBhutanBoliviaBosnia and HerzegovinaBotswanaBrazilBritish Virgin IslandsBrunei DarussalamBulgariaBurkina FasoBurundiCabo VerdeCambodiaCameroonCanadaCaribbean small statesCayman IslandsCentral African RepublicCentral Europe and the BalticsChadChileChinaColombiaComorosCongo, Dem. Rep.Congo, Rep.Costa RicaCote d'IvoireCroatiaCubaCyprusCzech RepublicDenmarkDjiboutiDominicaDominican RepublicEarly-demographic dividendEast Asia & PacificEast Asia & Pacific (excluding high income)East Asia & Pacific (IDA & IBRD countries)EcuadorEgypt, Arab Rep.El SalvadorEquatorial GuineaEritreaEstoniaEthiopiaEuro areaEurope & Central AsiaEurope & Central Asia (excluding high income)Europe & Central Asia (IDA & IBRD countries)European UnionFaroe IslandsFijiFinlandFragile and conflict affected situationsFranceFrench PolynesiaGabonGambia, TheGeorgiaGermanyGhanaGibraltarGreeceGreenlandGrenadaGuamGuatemalaGuineaGuinea-BissauGuyanaHaitiHeavily indebted poor countries (HIPC)High incomeHondurasHong Kong SAR, ChinaHungaryIBRD onlyIcelandIDA & IBRD totalIDA blendIDA onlyIDA totalIndiaIndonesiaIran, Islamic Rep.IraqIrelandIsraelItalyJamaicaJapanJordanKazakhstanKenyaKiribatiKorea, Dem. People’s Rep.Korea, Rep.KuwaitKyrgyz RepublicLao PDRLate-demographic dividendLatin America & Caribbean Latin America & Caribbean (excluding high income)Latin America & the Caribbean (IDA & IBRD countries)LatviaLeast developed countries: UN classificationLebanonLesothoLiberiaLibyaLithuaniaLow & middle incomeLow incomeLower middle incomeLuxembourgMacao SAR, ChinaMacedonia, FYRMadagascarMalawiMalaysiaMaldivesMaliMaltaMarshall IslandsMauritaniaMauritiusMexicoMicronesia, Fed. Sts.Middle East & North AfricaMiddle East & North Africa (excluding high income)Middle East & North Africa (IDA & IBRD countries)Middle incomeMoldovaMongoliaMoroccoMozambiqueMyanmarNamibiaNauruNepalNetherlandsNew CaledoniaNew ZealandNicaraguaNigerNigeriaNorth AmericaNorthern Mariana IslandsNorwayOECD membersOmanOther small statesPacific island small statesPakistanPalauPanamaPapua New GuineaParaguayPeruPhilippinesPolandPortugalPost-demographic dividendPre-demographic dividendPuerto RicoQatarRomaniaRussian FederationRwandaSamoaSao Tome and PrincipeSaudi ArabiaSenegalSerbiaSeychellesSierra LeoneSingaporeSlovak RepublicSloveniaSmall statesSolomon IslandsSomaliaSouth AfricaSouth AsiaSouth Asia (IDA & IBRD)SpainSri LankaSt. Kitts and NevisSt. LuciaSt. Vincent and the GrenadinesSub-Saharan Africa Sub-Saharan Africa (excluding high income)Sub-Saharan Africa (IDA & IBRD countries)SudanSurinameSwazilandSwedenSwitzerlandSyrian Arab RepublicTajikistanTanzaniaThailandTimor-LesteTogoTongaTrinidad and TobagoTunisiaTurkeyTurkmenistanTurks and Caicos IslandsTuvaluUgandaUkraineUnited Arab EmiratesUnited KingdomUnited StatesUpper middle incomeUruguayUzbekistanVanuatuVenezuela, RBVietnamVirgin Islands (U.S.)WorldYemen, Rep.ZambiaZimbabwe Timeline:
This timeline shows a graph from 1971 to 2009 of Least developed countries: UN classification. No data until 1970. Number of actual observations by date: 39.
Source name:
World Development Indicators
Source organization:
World Bank staff estimates from original source: European Commission, Joint Research Centre (JRC)/Netherlands Environmental Assessment Agency (PBL). Emission Database for Global Atmospheric Research (EDGAR): http://edgar.jrc.ec.europa.eu/.
Categories, topics:
Agriculture & Rural Development, Environment
Last updated:
apr 23, 2017
Indicators value changes by year
Minimum:
61.735
jan 1, 1984
Maximum:
73.432
jan 1, 2009
At the date of observation
Value
Absolute change
Change from previous value
jan 1, 1971
64.526
+64.526
0.0%
jan 1, 1972
66.476
+1.95
3.02%
jan 1, 1973
65.345
-1.131
-1.7%
jan 1, 1974
63.774
-1.571
-2.4%
jan 1, 1975
65.201
+1.427
2.24%
jan 1, 1976
66.029
+0.828
1.27%
jan 1, 1977
66.812
+0.783
1.19%
jan 1, 1978
65.737
-1.075
-1.61%
jan 1, 1979
63.822
-1.916
-2.91%
jan 1, 1980
65.083
+1.261
1.98%
jan 1, 1981
65.698
+0.615
0.94%
jan 1, 1982
65.617
-0.081
-0.12%
jan 1, 1983
66.62
+1.003
1.53%
jan 1, 1984
61.735
-4.885
-7.33%
jan 1, 1985
65.484
+3.749
6.07%
jan 1, 1986
66.047
+0.563
0.86%
jan 1, 1987
65.512
-0.534
-0.81%
jan 1, 1988
63.724
-1.789
-2.73%
jan 1, 1989
64.998
+1.275
2.0%
jan 1, 1990
67.907
+2.908
4.47%
jan 1, 1991
66.129
-1.778
-2.62%
jan 1, 1992
65.093
-1.036
-1.57%
jan 1, 1993
63.64
-1.453
-2.23%
jan 1, 1994
64.149
+0.509
0.8%
jan 1, 1995
64.996
+0.848
1.32%
jan 1, 1996
65.252
+0.255
0.39%
jan 1, 1997
67.183
+1.932
2.96%
jan 1, 1998
67.218
+0.035
0.05%
jan 1, 1999
66.405
-0.813
-1.21%
jan 1, 2000
66.704
+0.299
0.45%
jan 1, 2001
68.169
+1.465
2.2%
jan 1, 2002
66.764
-1.405
-2.06%
jan 1, 2003
68.706
+1.942
2.91%
jan 1, 2004
69.7
+0.994
1.45%
jan 1, 2005
67.558
-2.142
-3.07%
jan 1, 2006
70.285
+2.726
4.04%
jan 1, 2007
71.391
+1.107
1.57%
jan 1, 2008
70.964
-0.427
-0.6%
jan 1, 2009
73.432
+2.468
3.48%
Ranking of countries by current statistics by years


Comments: