29
/
en
AIzaSyAYiBZKx7MnpbEhh9jyipgxe19OcubqV5w
April 1, 2024
149956
Honduras
HND
true
2
1
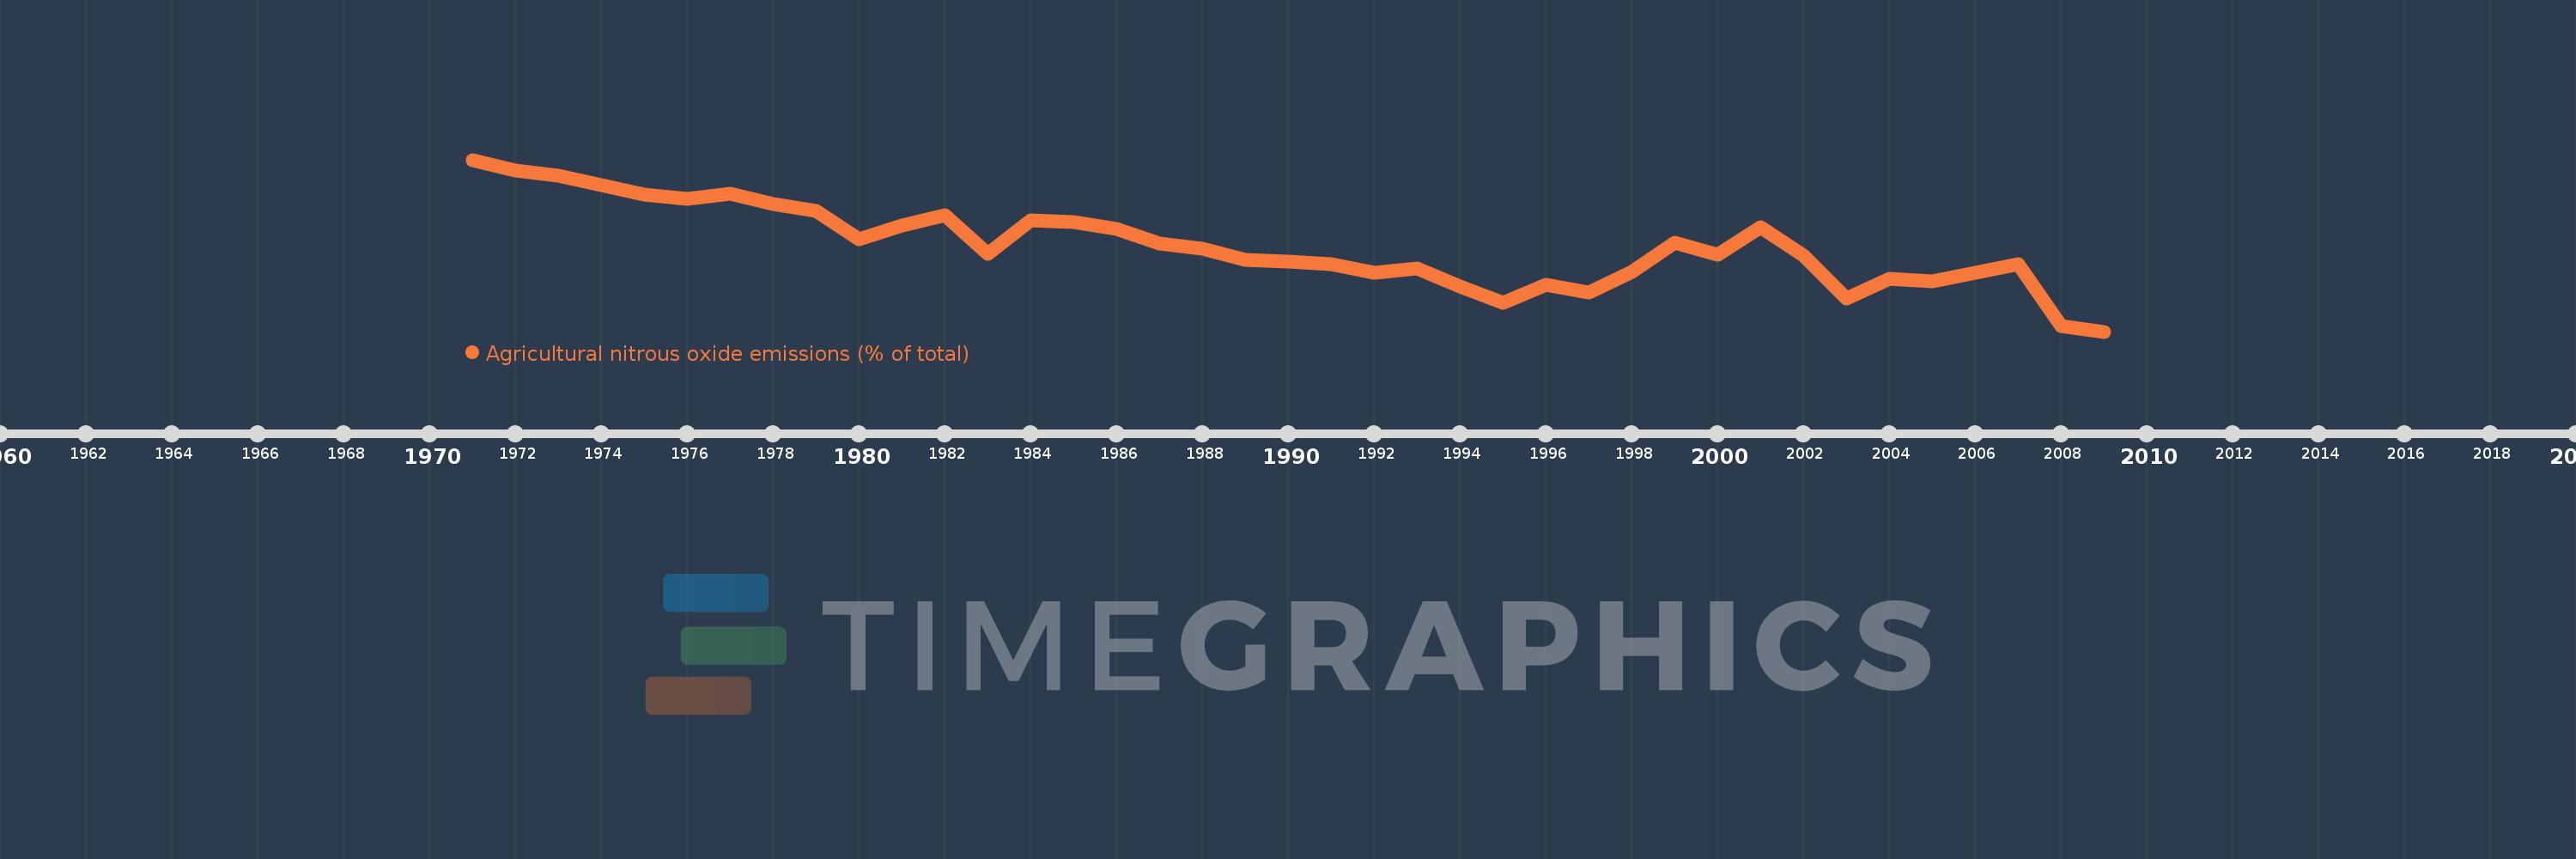
Agricultural nitrous oxide emissions (% of total)
2009,2008,2007,2006,2005,2004,2003,2002,2001,2000,1999,1998,1997,1996,1995,1994,1993,1992,1991,1990,1989,1988,1987,1986,1985,1984,1983,1982,1981,1980,1979,1978,1977,1976,1975,1974,1973,1972,1971
This statistics in other country:
AfghanistanAlbaniaAlgeriaAmerican SamoaAndorraAngolaAntigua and BarbudaArab WorldArgentinaArmeniaArubaAustraliaAustriaAzerbaijanBahamas, TheBahrainBangladeshBarbadosBelarusBelgiumBelizeBeninBermudaBhutanBoliviaBosnia and HerzegovinaBotswanaBrazilBritish Virgin IslandsBrunei DarussalamBulgariaBurkina FasoBurundiCabo VerdeCambodiaCameroonCanadaCaribbean small statesCayman IslandsCentral African RepublicCentral Europe and the BalticsChadChileChinaColombiaComorosCongo, Dem. Rep.Congo, Rep.Costa RicaCote d'IvoireCroatiaCubaCyprusCzech RepublicDenmarkDjiboutiDominicaDominican RepublicEarly-demographic dividendEast Asia & PacificEast Asia & Pacific (excluding high income)East Asia & Pacific (IDA & IBRD countries)EcuadorEgypt, Arab Rep.El SalvadorEquatorial GuineaEritreaEstoniaEthiopiaEuro areaEurope & Central AsiaEurope & Central Asia (excluding high income)Europe & Central Asia (IDA & IBRD countries)European UnionFaroe IslandsFijiFinlandFragile and conflict affected situationsFranceFrench PolynesiaGabonGambia, TheGeorgiaGermanyGhanaGibraltarGreeceGreenlandGrenadaGuamGuatemalaGuineaGuinea-BissauGuyanaHaitiHeavily indebted poor countries (HIPC)High incomeHondurasHong Kong SAR, ChinaHungaryIBRD onlyIcelandIDA & IBRD totalIDA blendIDA onlyIDA totalIndiaIndonesiaIran, Islamic Rep.IraqIrelandIsraelItalyJamaicaJapanJordanKazakhstanKenyaKiribatiKorea, Dem. People’s Rep.Korea, Rep.KuwaitKyrgyz RepublicLao PDRLate-demographic dividendLatin America & Caribbean Latin America & Caribbean (excluding high income)Latin America & the Caribbean (IDA & IBRD countries)LatviaLeast developed countries: UN classificationLebanonLesothoLiberiaLibyaLithuaniaLow & middle incomeLow incomeLower middle incomeLuxembourgMacao SAR, ChinaMacedonia, FYRMadagascarMalawiMalaysiaMaldivesMaliMaltaMarshall IslandsMauritaniaMauritiusMexicoMicronesia, Fed. Sts.Middle East & North AfricaMiddle East & North Africa (excluding high income)Middle East & North Africa (IDA & IBRD countries)Middle incomeMoldovaMongoliaMoroccoMozambiqueMyanmarNamibiaNauruNepalNetherlandsNew CaledoniaNew ZealandNicaraguaNigerNigeriaNorth AmericaNorthern Mariana IslandsNorwayOECD membersOmanOther small statesPacific island small statesPakistanPalauPanamaPapua New GuineaParaguayPeruPhilippinesPolandPortugalPost-demographic dividendPre-demographic dividendPuerto RicoQatarRomaniaRussian FederationRwandaSamoaSao Tome and PrincipeSaudi ArabiaSenegalSerbiaSeychellesSierra LeoneSingaporeSlovak RepublicSloveniaSmall statesSolomon IslandsSomaliaSouth AfricaSouth AsiaSouth Asia (IDA & IBRD)SpainSri LankaSt. Kitts and NevisSt. LuciaSt. Vincent and the GrenadinesSub-Saharan Africa Sub-Saharan Africa (excluding high income)Sub-Saharan Africa (IDA & IBRD countries)SudanSurinameSwazilandSwedenSwitzerlandSyrian Arab RepublicTajikistanTanzaniaThailandTimor-LesteTogoTongaTrinidad and TobagoTunisiaTurkeyTurkmenistanTurks and Caicos IslandsTuvaluUgandaUkraineUnited Arab EmiratesUnited KingdomUnited StatesUpper middle incomeUruguayUzbekistanVanuatuVenezuela, RBVietnamVirgin Islands (U.S.)WorldYemen, Rep.ZambiaZimbabwe Timeline:
This timeline shows a graph from 1971 to 2009 of Honduras. No data until 1970. Number of actual observations by date: 39.
Source name:
World Development Indicators
Source organization:
World Bank staff estimates from original source: European Commission, Joint Research Centre (JRC)/Netherlands Environmental Assessment Agency (PBL). Emission Database for Global Atmospheric Research (EDGAR): http://edgar.jrc.ec.europa.eu/.
Categories, topics:
Agriculture & Rural Development, Environment
Last updated:
apr 23, 2017
Indicators value changes by year
Minimum:
75.716
jan 1, 2009
Maximum:
88.127
jan 1, 1971
At the date of observation
Value
Absolute change
Change from previous value
jan 1, 1971
88.127
+88.127
0.0%
jan 1, 1972
87.371
-0.756
-0.86%
jan 1, 1973
86.982
-0.389
-0.44%
jan 1, 1974
86.317
-0.665
-0.76%
jan 1, 1975
85.636
-0.681
-0.79%
jan 1, 1976
85.328
-0.309
-0.36%
jan 1, 1977
85.672
+0.345
0.4%
jan 1, 1978
84.913
-0.759
-0.89%
jan 1, 1979
84.436
-0.477
-0.56%
jan 1, 1980
82.375
-2.061
-2.44%
jan 1, 1981
83.395
+1.021
1.24%
jan 1, 1982
84.122
+0.727
0.87%
jan 1, 1983
81.334
-2.788
-3.31%
jan 1, 1984
83.757
+2.423
2.98%
jan 1, 1985
83.605
-0.152
-0.18%
jan 1, 1986
83.148
-0.457
-0.55%
jan 1, 1987
82.092
-1.056
-1.27%
jan 1, 1988
81.678
-0.414
-0.5%
jan 1, 1989
80.915
-0.763
-0.93%
jan 1, 1990
80.774
-0.141
-0.17%
jan 1, 1991
80.595
-0.18
-0.22%
jan 1, 1992
79.972
-0.622
-0.77%
jan 1, 1993
80.26
+0.288
0.36%
jan 1, 1994
78.989
-1.271
-1.58%
jan 1, 1995
77.786
-1.203
-1.52%
jan 1, 1996
79.099
+1.314
1.69%
jan 1, 1997
78.545
-0.554
-0.7%
jan 1, 1998
80.046
+1.501
1.91%
jan 1, 1999
82.147
+2.101
2.62%
jan 1, 2000
81.289
-0.858
-1.04%
jan 1, 2001
83.235
+1.946
2.39%
jan 1, 2002
81.195
-2.039
-2.45%
jan 1, 2003
78.131
-3.064
-3.77%
jan 1, 2004
79.539
+1.408
1.8%
jan 1, 2005
79.355
-0.184
-0.23%
jan 1, 2006
79.948
+0.593
0.75%
jan 1, 2007
80.575
+0.627
0.78%
jan 1, 2008
76.109
-4.466
-5.54%
jan 1, 2009
75.716
-0.393
-0.52%
Ranking of countries by current statistics by years


Comments: