29
/
en
AIzaSyAYiBZKx7MnpbEhh9jyipgxe19OcubqV5w
April 1, 2024
78378
Bangladesh
BGD
true
2
1
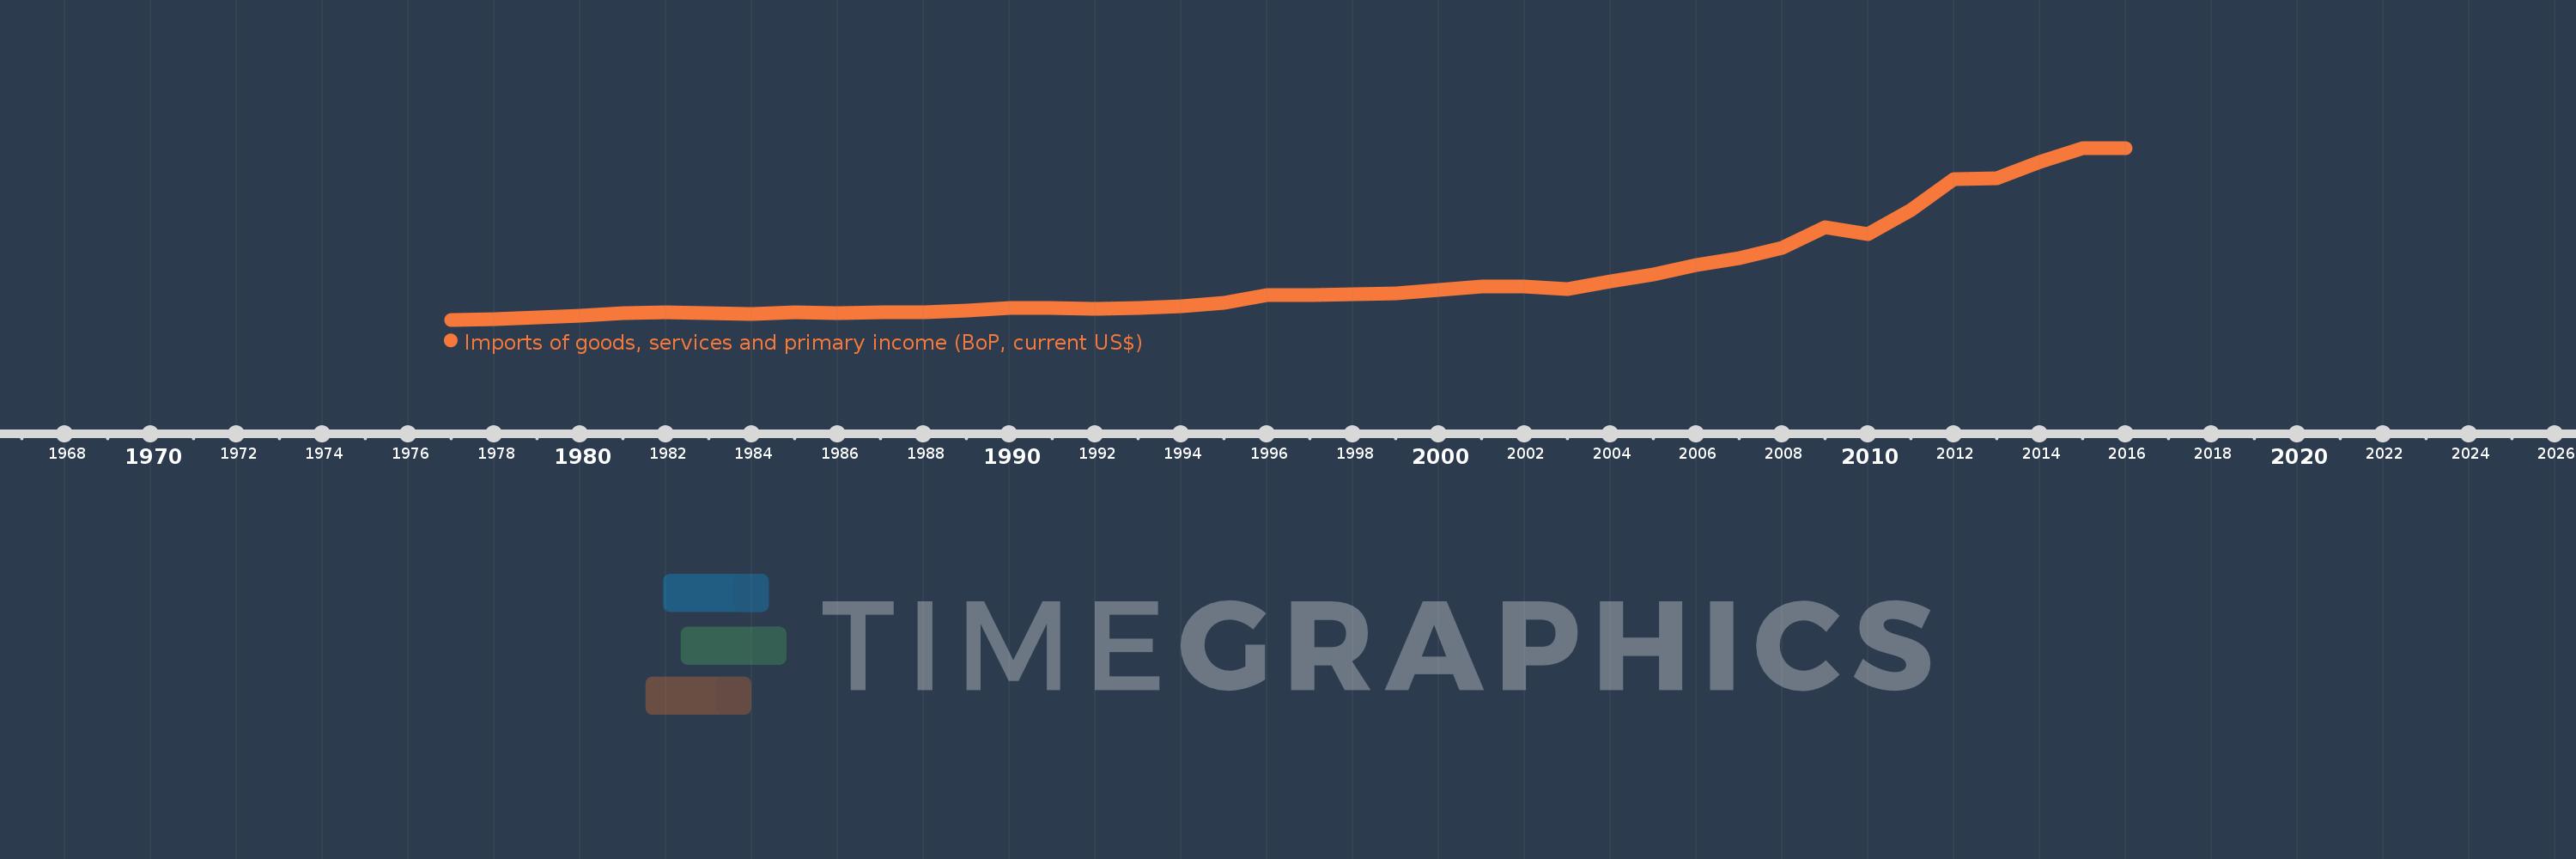
Imports of goods, services and primary income (BoP, current US$)
2016,2015,2014,2013,2012,2011,2010,2009,2008,2007,2006,2005,2004,2003,2002,2001,2000,1999,1998,1997,1996,1995,1994,1993,1992,1991,1990,1989,1988,1987,1986,1985,1984,1983,1982,1981,1980,1979,1978,1977
This statistics in other country:
AfghanistanAlbaniaAlgeriaAngolaAntigua and BarbudaArab WorldArgentinaArmeniaArubaAustraliaAustriaAzerbaijanBahamas, TheBahrainBangladeshBarbadosBelarusBelgiumBelizeBeninBermudaBhutanBoliviaBosnia and HerzegovinaBotswanaBrazilBrunei DarussalamBulgariaBurkina FasoBurundiCabo VerdeCambodiaCameroonCanadaCaribbean small statesCentral African RepublicCentral Europe and the BalticsChadChileChinaColombiaComorosCongo, Dem. Rep.Congo, Rep.Costa RicaCote d'IvoireCroatiaCuracaoCyprusCzech RepublicDenmarkDjiboutiDominicaDominican RepublicEarly-demographic dividendEast Asia & PacificEast Asia & Pacific (excluding high income)East Asia & Pacific (IDA & IBRD countries)EcuadorEgypt, Arab Rep.El SalvadorEquatorial GuineaEritreaEstoniaEthiopiaEuro areaEurope & Central AsiaEurope & Central Asia (excluding high income)Europe & Central Asia (IDA & IBRD countries)European UnionFaroe IslandsFijiFinlandFragile and conflict affected situationsFranceFrench PolynesiaGabonGambia, TheGeorgiaGermanyGhanaGreeceGrenadaGuatemalaGuineaGuinea-BissauGuyanaHaitiHeavily indebted poor countries (HIPC)High incomeHondurasHong Kong SAR, ChinaHungaryIBRD onlyIcelandIDA & IBRD totalIDA blendIDA onlyIDA totalIndiaIndonesiaIran, Islamic Rep.IraqIrelandIsraelItalyJamaicaJapanJordanKazakhstanKenyaKiribatiKorea, Rep.KosovoKuwaitKyrgyz RepublicLao PDRLate-demographic dividendLatin America & Caribbean Latin America & Caribbean (excluding high income)Latin America & the Caribbean (IDA & IBRD countries)LatviaLeast developed countries: UN classificationLebanonLesothoLiberiaLibyaLithuaniaLow & middle incomeLow incomeLower middle incomeLuxembourgMacao SAR, ChinaMacedonia, FYRMadagascarMalawiMalaysiaMaldivesMaliMaltaMarshall IslandsMauritaniaMauritiusMexicoMicronesia, Fed. Sts.Middle East & North Africa (excluding high income)Middle East & North Africa (IDA & IBRD countries)Middle incomeMoldovaMongoliaMontenegroMoroccoMozambiqueMyanmarNamibiaNepalNetherlandsNew CaledoniaNicaraguaNigerNigeriaNorth AmericaNorwayOECD membersOmanOther small statesPacific island small statesPakistanPalauPanamaPapua New GuineaParaguayPeruPhilippinesPolandPortugalPost-demographic dividendPre-demographic dividendQatarRomaniaRussian FederationRwandaSamoaSao Tome and PrincipeSaudi ArabiaSenegalSerbiaSeychellesSierra LeoneSingaporeSint Maarten (Dutch part)Slovak RepublicSloveniaSmall statesSolomon IslandsSouth AfricaSouth AsiaSouth Asia (IDA & IBRD)South SudanSpainSri LankaSt. Kitts and NevisSt. LuciaSt. Vincent and the GrenadinesSub-Saharan Africa Sub-Saharan Africa (excluding high income)Sub-Saharan Africa (IDA & IBRD countries)SudanSurinameSwazilandSwedenSwitzerlandSyrian Arab RepublicTajikistanTanzaniaThailandTimor-LesteTogoTongaTrinidad and TobagoTunisiaTurkeyTuvaluUgandaUkraineUnited KingdomUnited StatesUpper middle incomeUruguayVanuatuVenezuela, RBVietnamWest Bank and GazaWorldYemen, Rep.ZambiaZimbabwe Timeline:
This timeline shows a graph from 1977 to 2016 of Bangladesh. No data until 1976. Number of actual observations by date: 40.
Source name:
World Development Indicators
Source organization:
International Monetary Fund, Balance of Payments Statistics Yearbook and data files.
Categories, topics:
Economy & Growth, External Debt, Trade
Last updated:
apr 23, 2017
Indicators value changes by year
Minimum:
988.006 mln
jan 1, 1977
Maximum:
48.113 bln
jan 1, 2016
At the date of observation
Value
Absolute change
Change from previous value
jan 1, 1977
988.006 mln
+988.006 mln
0.0%
jan 1, 1978
1.263 bln
+274.649 mln
27.8%
jan 1, 1979
1.654 bln
+391.585 mln
31.01%
jan 1, 1980
2.164 bln
+509.674 mln
30.81%
jan 1, 1981
2.904 bln
+739.835 mln
34.19%
jan 1, 1982
2.996 bln
+91.825 mln
3.16%
jan 1, 1983
2.815 bln
-180.596 mln
-6.03%
jan 1, 1984
2.454 bln
-361.392 mln
-12.84%
jan 1, 1985
2.954 bln
+500.186 mln
20.39%
jan 1, 1986
2.918 bln
-35.73 mln
-1.21%
jan 1, 1987
2.971 bln
+52.904 mln
1.81%
jan 1, 1988
3.112 bln
+141.386 mln
4.76%
jan 1, 1989
3.528 bln
+415.938 mln
13.36%
jan 1, 1990
4.223 bln
+695.158 mln
19.7%
jan 1, 1991
4.14 bln
-83.857 mln
-1.99%
jan 1, 1992
3.937 bln
-202.92 mln
-4.9%
jan 1, 1993
4.309 bln
+371.877 mln
9.45%
jan 1, 1994
4.765 bln
+456.7 mln
10.6%
jan 1, 1995
5.564 bln
+799.078 mln
16.77%
jan 1, 1996
7.79 bln
+2.226 bln
40.01%
jan 1, 1997
7.644 bln
-146.66 mln
-1.88%
jan 1, 1998
8.032 bln
+388.698 mln
5.09%
jan 1, 1999
8.159 bln
+126.549 mln
1.58%
jan 1, 2000
9.191 bln
+1.032 bln
12.65%
jan 1, 2001
10.018 bln
+827.239 mln
9.0%
jan 1, 2002
10.017 bln
-1.103 mln
-0.01%
jan 1, 2003
9.442 bln
-574.988 mln
-5.74%
jan 1, 2004
11.431 bln
+1.989 bln
21.07%
jan 1, 2005
13.446 bln
+2.015 bln
17.63%
jan 1, 2006
15.97 bln
+2.523 bln
18.77%
jan 1, 2007
17.802 bln
+1.832 bln
11.47%
jan 1, 2008
20.765 bln
+2.963 bln
16.65%
jan 1, 2009
26.379 bln
+5.614 bln
27.03%
jan 1, 2010
24.507 bln
-1.872 bln
-7.1%
jan 1, 2011
31.035 bln
+6.528 bln
26.64%
jan 1, 2012
39.553 bln
+8.518 bln
27.45%
jan 1, 2013
39.74 bln
+187.787 mln
0.47%
jan 1, 2014
44.208 bln
+4.468 bln
11.24%
jan 1, 2015
47.985 bln
+3.777 bln
8.54%
jan 1, 2016
48.113 bln
+127.988 mln
0.27%
Ranking of countries by current statistics by years


Comments: