29
/
en
AIzaSyAYiBZKx7MnpbEhh9jyipgxe19OcubqV5w
April 1, 2024
51001
Middle income
MIC
false
2
1
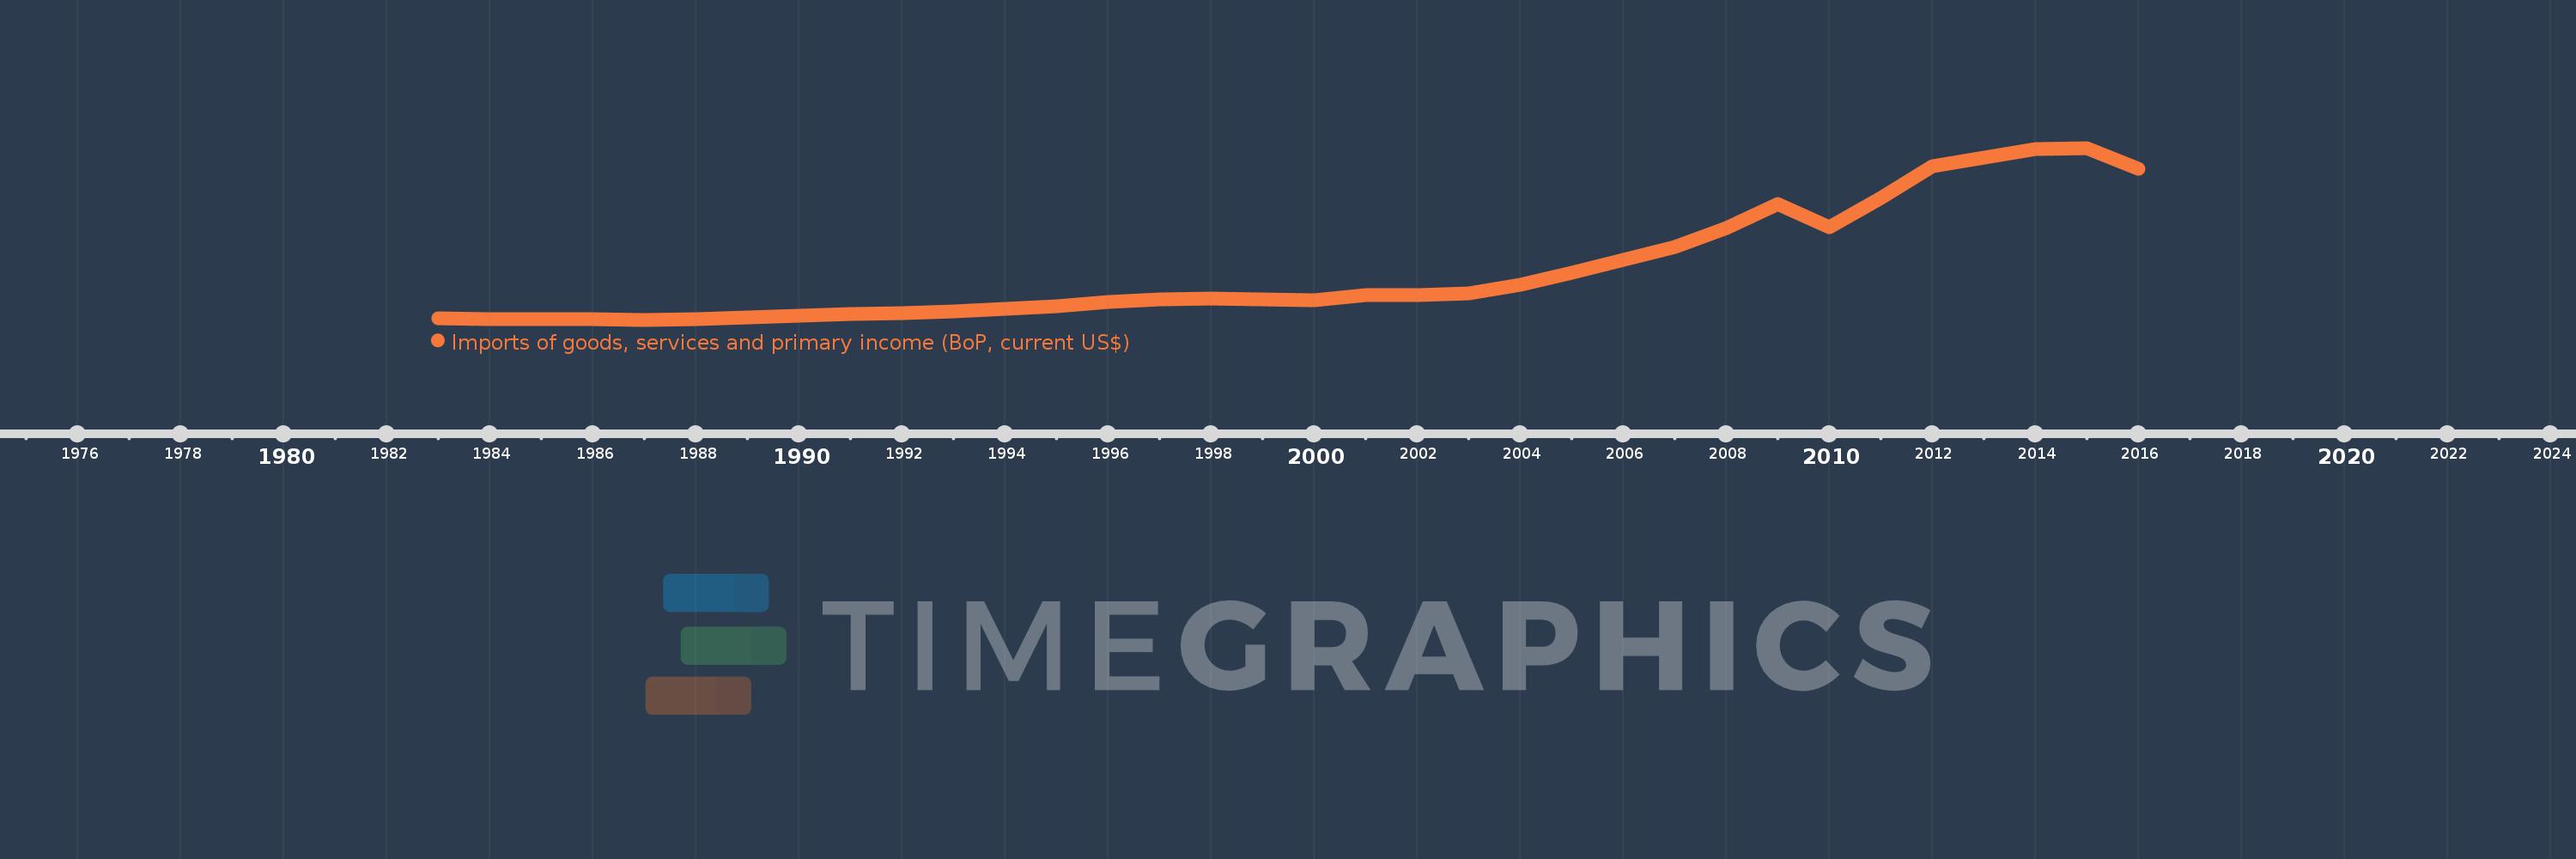
Imports of goods, services and primary income (BoP, current US$)
2016,2015,2014,2013,2012,2011,2010,2009,2008,2007,2006,2005,2004,2003,2002,2001,2000,1999,1998,1997,1996,1995,1994,1993,1992,1991,1990,1989,1988,1987,1986,1985,1984,1983
This statistics in other country:
AfghanistanAlbaniaAlgeriaAngolaAntigua and BarbudaArab WorldArgentinaArmeniaArubaAustraliaAustriaAzerbaijanBahamas, TheBahrainBangladeshBarbadosBelarusBelgiumBelizeBeninBermudaBhutanBoliviaBosnia and HerzegovinaBotswanaBrazilBrunei DarussalamBulgariaBurkina FasoBurundiCabo VerdeCambodiaCameroonCanadaCaribbean small statesCentral African RepublicCentral Europe and the BalticsChadChileChinaColombiaComorosCongo, Dem. Rep.Congo, Rep.Costa RicaCote d'IvoireCroatiaCuracaoCyprusCzech RepublicDenmarkDjiboutiDominicaDominican RepublicEarly-demographic dividendEast Asia & PacificEast Asia & Pacific (excluding high income)East Asia & Pacific (IDA & IBRD countries)EcuadorEgypt, Arab Rep.El SalvadorEquatorial GuineaEritreaEstoniaEthiopiaEuro areaEurope & Central AsiaEurope & Central Asia (excluding high income)Europe & Central Asia (IDA & IBRD countries)European UnionFaroe IslandsFijiFinlandFragile and conflict affected situationsFranceFrench PolynesiaGabonGambia, TheGeorgiaGermanyGhanaGreeceGrenadaGuatemalaGuineaGuinea-BissauGuyanaHaitiHeavily indebted poor countries (HIPC)High incomeHondurasHong Kong SAR, ChinaHungaryIBRD onlyIcelandIDA & IBRD totalIDA blendIDA onlyIDA totalIndiaIndonesiaIran, Islamic Rep.IraqIrelandIsraelItalyJamaicaJapanJordanKazakhstanKenyaKiribatiKorea, Rep.KosovoKuwaitKyrgyz RepublicLao PDRLate-demographic dividendLatin America & Caribbean Latin America & Caribbean (excluding high income)Latin America & the Caribbean (IDA & IBRD countries)LatviaLeast developed countries: UN classificationLebanonLesothoLiberiaLibyaLithuaniaLow & middle incomeLow incomeLower middle incomeLuxembourgMacao SAR, ChinaMacedonia, FYRMadagascarMalawiMalaysiaMaldivesMaliMaltaMarshall IslandsMauritaniaMauritiusMexicoMicronesia, Fed. Sts.Middle East & North Africa (excluding high income)Middle East & North Africa (IDA & IBRD countries)Middle incomeMoldovaMongoliaMontenegroMoroccoMozambiqueMyanmarNamibiaNepalNetherlandsNew CaledoniaNicaraguaNigerNigeriaNorth AmericaNorwayOECD membersOmanOther small statesPacific island small statesPakistanPalauPanamaPapua New GuineaParaguayPeruPhilippinesPolandPortugalPost-demographic dividendPre-demographic dividendQatarRomaniaRussian FederationRwandaSamoaSao Tome and PrincipeSaudi ArabiaSenegalSerbiaSeychellesSierra LeoneSingaporeSint Maarten (Dutch part)Slovak RepublicSloveniaSmall statesSolomon IslandsSouth AfricaSouth AsiaSouth Asia (IDA & IBRD)South SudanSpainSri LankaSt. Kitts and NevisSt. LuciaSt. Vincent and the GrenadinesSub-Saharan Africa Sub-Saharan Africa (excluding high income)Sub-Saharan Africa (IDA & IBRD countries)SudanSurinameSwazilandSwedenSwitzerlandSyrian Arab RepublicTajikistanTanzaniaThailandTimor-LesteTogoTongaTrinidad and TobagoTunisiaTurkeyTuvaluUgandaUkraineUnited KingdomUnited StatesUpper middle incomeUruguayVanuatuVenezuela, RBVietnamWest Bank and GazaWorldYemen, Rep.ZambiaZimbabwe Timeline:
This timeline shows a graph from 1983 to 2016 of Middle income. No data until 1982. Number of actual observations by date: 34.
Source name:
World Development Indicators
Source organization:
International Monetary Fund, Balance of Payments Statistics Yearbook and data files.
Categories, topics:
Economy & Growth, External Debt, Trade
Last updated:
apr 23, 2017
Indicators value changes by year
Minimum:
453.788 bln
jan 1, 1987
Maximum:
8.033 trl
jan 1, 2015
At the date of observation
Value
Absolute change
Change from previous value
jan 1, 1983
521.475 bln
+521.475 bln
0.0%
jan 1, 1984
479.267 bln
-42.208 bln
-8.09%
jan 1, 1985
488.007 bln
+8.74 bln
1.82%
jan 1, 1986
480.053 bln
-7.954 bln
-1.63%
jan 1, 1987
453.788 bln
-26.264 bln
-5.47%
jan 1, 1988
495.8 bln
+42.012 bln
9.26%
jan 1, 1989
560.646 bln
+64.845 bln
13.08%
jan 1, 1990
616.985 bln
+56.34 bln
10.05%
jan 1, 1991
691.974 bln
+74.989 bln
12.15%
jan 1, 1992
743.265 bln
+51.291 bln
7.41%
jan 1, 1993
834.08 bln
+90.815 bln
12.22%
jan 1, 1994
930.213 bln
+96.133 bln
11.53%
jan 1, 1995
1.031 trl
+101.194 bln
10.88%
jan 1, 1996
1.242 trl
+210.809 bln
20.44%
jan 1, 1997
1.353 trl
+111.021 bln
8.94%
jan 1, 1998
1.383 trl
+29.591 bln
2.19%
jan 1, 1999
1.35 trl
-33.271 bln
-2.41%
jan 1, 2000
1.325 trl
-24.47 bln
-1.81%
jan 1, 2001
1.554 trl
+229.22 bln
17.3%
jan 1, 2002
1.553 trl
-1.007 bln
-0.06%
jan 1, 2003
1.599 trl
+45.555 bln
2.93%
jan 1, 2004
2.008 trl
+408.711 bln
25.56%
jan 1, 2005
2.536 trl
+528.744 bln
26.34%
jan 1, 2006
3.085 trl
+549.069 bln
21.65%
jan 1, 2007
3.67 trl
+584.547 bln
18.95%
jan 1, 2008
4.503 trl
+833.28 bln
22.71%
jan 1, 2009
5.549 trl
+1.046 trl
23.23%
jan 1, 2010
4.55 trl
-999.691 bln
-18.01%
jan 1, 2011
5.821 trl
+1.271 trl
27.95%
jan 1, 2012
7.234 trl
+1.413 trl
24.27%
jan 1, 2013
7.586 trl
+352.148 bln
4.87%
jan 1, 2014
7.986 trl
+399.264 bln
5.26%
jan 1, 2015
8.033 trl
+47.607 bln
0.6%
jan 1, 2016
7.106 trl
-926.785 bln
-11.54%
Ranking of countries by current statistics by years


Comments: