29
/
en
AIzaSyAYiBZKx7MnpbEhh9jyipgxe19OcubqV5w
April 1, 2024
117011
Cyprus
CYP
true
2
1
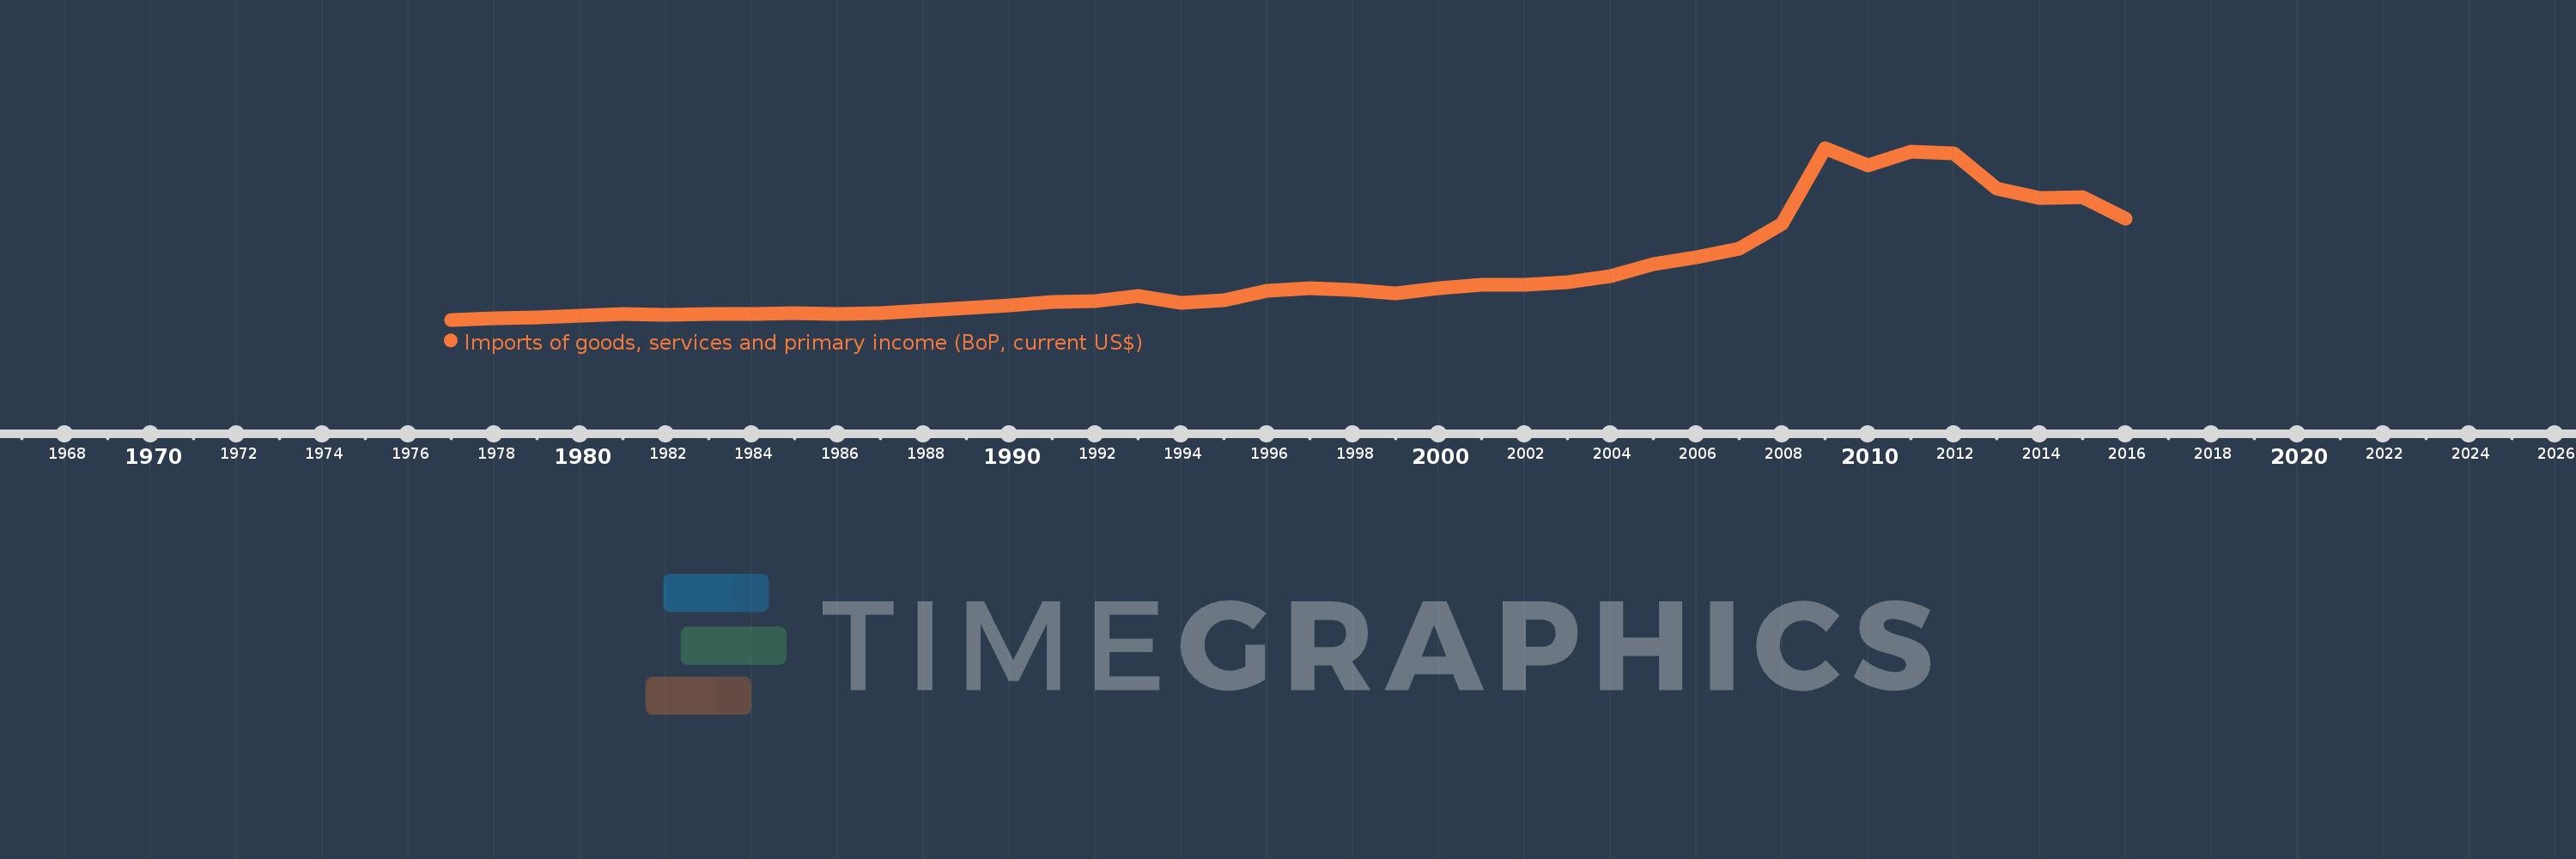
Imports of goods, services and primary income (BoP, current US$)
2016,2015,2014,2013,2012,2011,2010,2009,2008,2007,2006,2005,2004,2003,2002,2001,2000,1999,1998,1997,1996,1995,1994,1993,1992,1991,1990,1989,1988,1987,1986,1985,1984,1983,1982,1981,1980,1979,1978,1977
This statistics in other country:
AfghanistanAlbaniaAlgeriaAngolaAntigua and BarbudaArab WorldArgentinaArmeniaArubaAustraliaAustriaAzerbaijanBahamas, TheBahrainBangladeshBarbadosBelarusBelgiumBelizeBeninBermudaBhutanBoliviaBosnia and HerzegovinaBotswanaBrazilBrunei DarussalamBulgariaBurkina FasoBurundiCabo VerdeCambodiaCameroonCanadaCaribbean small statesCentral African RepublicCentral Europe and the BalticsChadChileChinaColombiaComorosCongo, Dem. Rep.Congo, Rep.Costa RicaCote d'IvoireCroatiaCuracaoCyprusCzech RepublicDenmarkDjiboutiDominicaDominican RepublicEarly-demographic dividendEast Asia & PacificEast Asia & Pacific (excluding high income)East Asia & Pacific (IDA & IBRD countries)EcuadorEgypt, Arab Rep.El SalvadorEquatorial GuineaEritreaEstoniaEthiopiaEuro areaEurope & Central AsiaEurope & Central Asia (excluding high income)Europe & Central Asia (IDA & IBRD countries)European UnionFaroe IslandsFijiFinlandFragile and conflict affected situationsFranceFrench PolynesiaGabonGambia, TheGeorgiaGermanyGhanaGreeceGrenadaGuatemalaGuineaGuinea-BissauGuyanaHaitiHeavily indebted poor countries (HIPC)High incomeHondurasHong Kong SAR, ChinaHungaryIBRD onlyIcelandIDA & IBRD totalIDA blendIDA onlyIDA totalIndiaIndonesiaIran, Islamic Rep.IraqIrelandIsraelItalyJamaicaJapanJordanKazakhstanKenyaKiribatiKorea, Rep.KosovoKuwaitKyrgyz RepublicLao PDRLate-demographic dividendLatin America & Caribbean Latin America & Caribbean (excluding high income)Latin America & the Caribbean (IDA & IBRD countries)LatviaLeast developed countries: UN classificationLebanonLesothoLiberiaLibyaLithuaniaLow & middle incomeLow incomeLower middle incomeLuxembourgMacao SAR, ChinaMacedonia, FYRMadagascarMalawiMalaysiaMaldivesMaliMaltaMarshall IslandsMauritaniaMauritiusMexicoMicronesia, Fed. Sts.Middle East & North Africa (excluding high income)Middle East & North Africa (IDA & IBRD countries)Middle incomeMoldovaMongoliaMontenegroMoroccoMozambiqueMyanmarNamibiaNepalNetherlandsNew CaledoniaNicaraguaNigerNigeriaNorth AmericaNorwayOECD membersOmanOther small statesPacific island small statesPakistanPalauPanamaPapua New GuineaParaguayPeruPhilippinesPolandPortugalPost-demographic dividendPre-demographic dividendQatarRomaniaRussian FederationRwandaSamoaSao Tome and PrincipeSaudi ArabiaSenegalSerbiaSeychellesSierra LeoneSingaporeSint Maarten (Dutch part)Slovak RepublicSloveniaSmall statesSolomon IslandsSouth AfricaSouth AsiaSouth Asia (IDA & IBRD)South SudanSpainSri LankaSt. Kitts and NevisSt. LuciaSt. Vincent and the GrenadinesSub-Saharan Africa Sub-Saharan Africa (excluding high income)Sub-Saharan Africa (IDA & IBRD countries)SudanSurinameSwazilandSwedenSwitzerlandSyrian Arab RepublicTajikistanTanzaniaThailandTimor-LesteTogoTongaTrinidad and TobagoTunisiaTurkeyTuvaluUgandaUkraineUnited KingdomUnited StatesUpper middle incomeUruguayVanuatuVenezuela, RBVietnamWest Bank and GazaWorldYemen, Rep.ZambiaZimbabwe Timeline:
This timeline shows a graph from 1977 to 2016 of Cyprus. No data until 1976. Number of actual observations by date: 40.
Source name:
World Development Indicators
Source organization:
International Monetary Fund, Balance of Payments Statistics Yearbook and data files.
Categories, topics:
Economy & Growth, External Debt, Trade
Last updated:
apr 23, 2017
Indicators value changes by year
Minimum:
533.501 mln
jan 1, 1977
Maximum:
28.589 bln
jan 1, 2009
At the date of observation
Value
Absolute change
Change from previous value
jan 1, 1977
533.501 mln
+533.501 mln
0.0%
jan 1, 1978
728.214 mln
+194.713 mln
36.5%
jan 1, 1979
888.323 mln
+160.109 mln
21.99%
jan 1, 1980
1.183 bln
+294.939 mln
33.2%
jan 1, 1981
1.41 bln
+227.013 mln
19.19%
jan 1, 1982
1.391 bln
-19.537 mln
-1.39%
jan 1, 1983
1.474 bln
+83.432 mln
6.0%
jan 1, 1984
1.485 bln
+10.333 mln
0.7%
jan 1, 1985
1.631 bln
+146.399 mln
9.86%
jan 1, 1986
1.531 bln
-100.095 mln
-6.14%
jan 1, 1987
1.631 bln
+100.402 mln
6.56%
jan 1, 1988
2.0 bln
+369.22 mln
22.63%
jan 1, 1989
2.44 bln
+439.411 mln
21.97%
jan 1, 1990
2.897 bln
+456.9 mln
18.73%
jan 1, 1991
3.395 bln
+498.3 mln
17.2%
jan 1, 1992
3.513 bln
+118.309 mln
3.48%
jan 1, 1993
4.42 bln
+906.639 mln
25.81%
jan 1, 1994
3.338 bln
-1.082 bln
-24.48%
jan 1, 1995
3.776 bln
+438.254 mln
13.13%
jan 1, 1996
5.306 bln
+1.53 bln
40.52%
jan 1, 1997
5.627 bln
+320.584 mln
6.04%
jan 1, 1998
5.446 bln
-181.011 mln
-3.22%
jan 1, 1999
4.883 bln
-562.304 mln
-10.33%
jan 1, 2000
5.714 bln
+830.498 mln
17.01%
jan 1, 2001
6.257 bln
+542.769 mln
9.5%
jan 1, 2002
6.25 bln
-6.222 mln
-0.1%
jan 1, 2003
6.635 bln
+384.728 mln
6.16%
jan 1, 2004
7.639 bln
+1.004 bln
15.13%
jan 1, 2005
9.564 bln
+1.924 bln
25.19%
jan 1, 2006
10.744 bln
+1.181 bln
12.35%
jan 1, 2007
12.177 bln
+1.433 bln
13.33%
jan 1, 2008
16.267 bln
+4.09 bln
33.59%
jan 1, 2009
28.589 bln
+12.322 bln
75.75%
jan 1, 2010
25.698 bln
-2.891 bln
-10.11%
jan 1, 2011
27.972 bln
+2.275 bln
8.85%
jan 1, 2012
27.704 bln
-267.839 mln
-0.96%
jan 1, 2013
21.933 bln
-5.772 bln
-20.83%
jan 1, 2014
20.365 bln
-1.568 bln
-7.15%
jan 1, 2015
20.562 bln
+196.902 mln
0.97%
jan 1, 2016
17.022 bln
-3.54 bln
-17.22%
Ranking of countries by current statistics by years


Comments: