29
/
en
AIzaSyAYiBZKx7MnpbEhh9jyipgxe19OcubqV5w
April 1, 2024
201702
Morocco
MAR
true
2
1
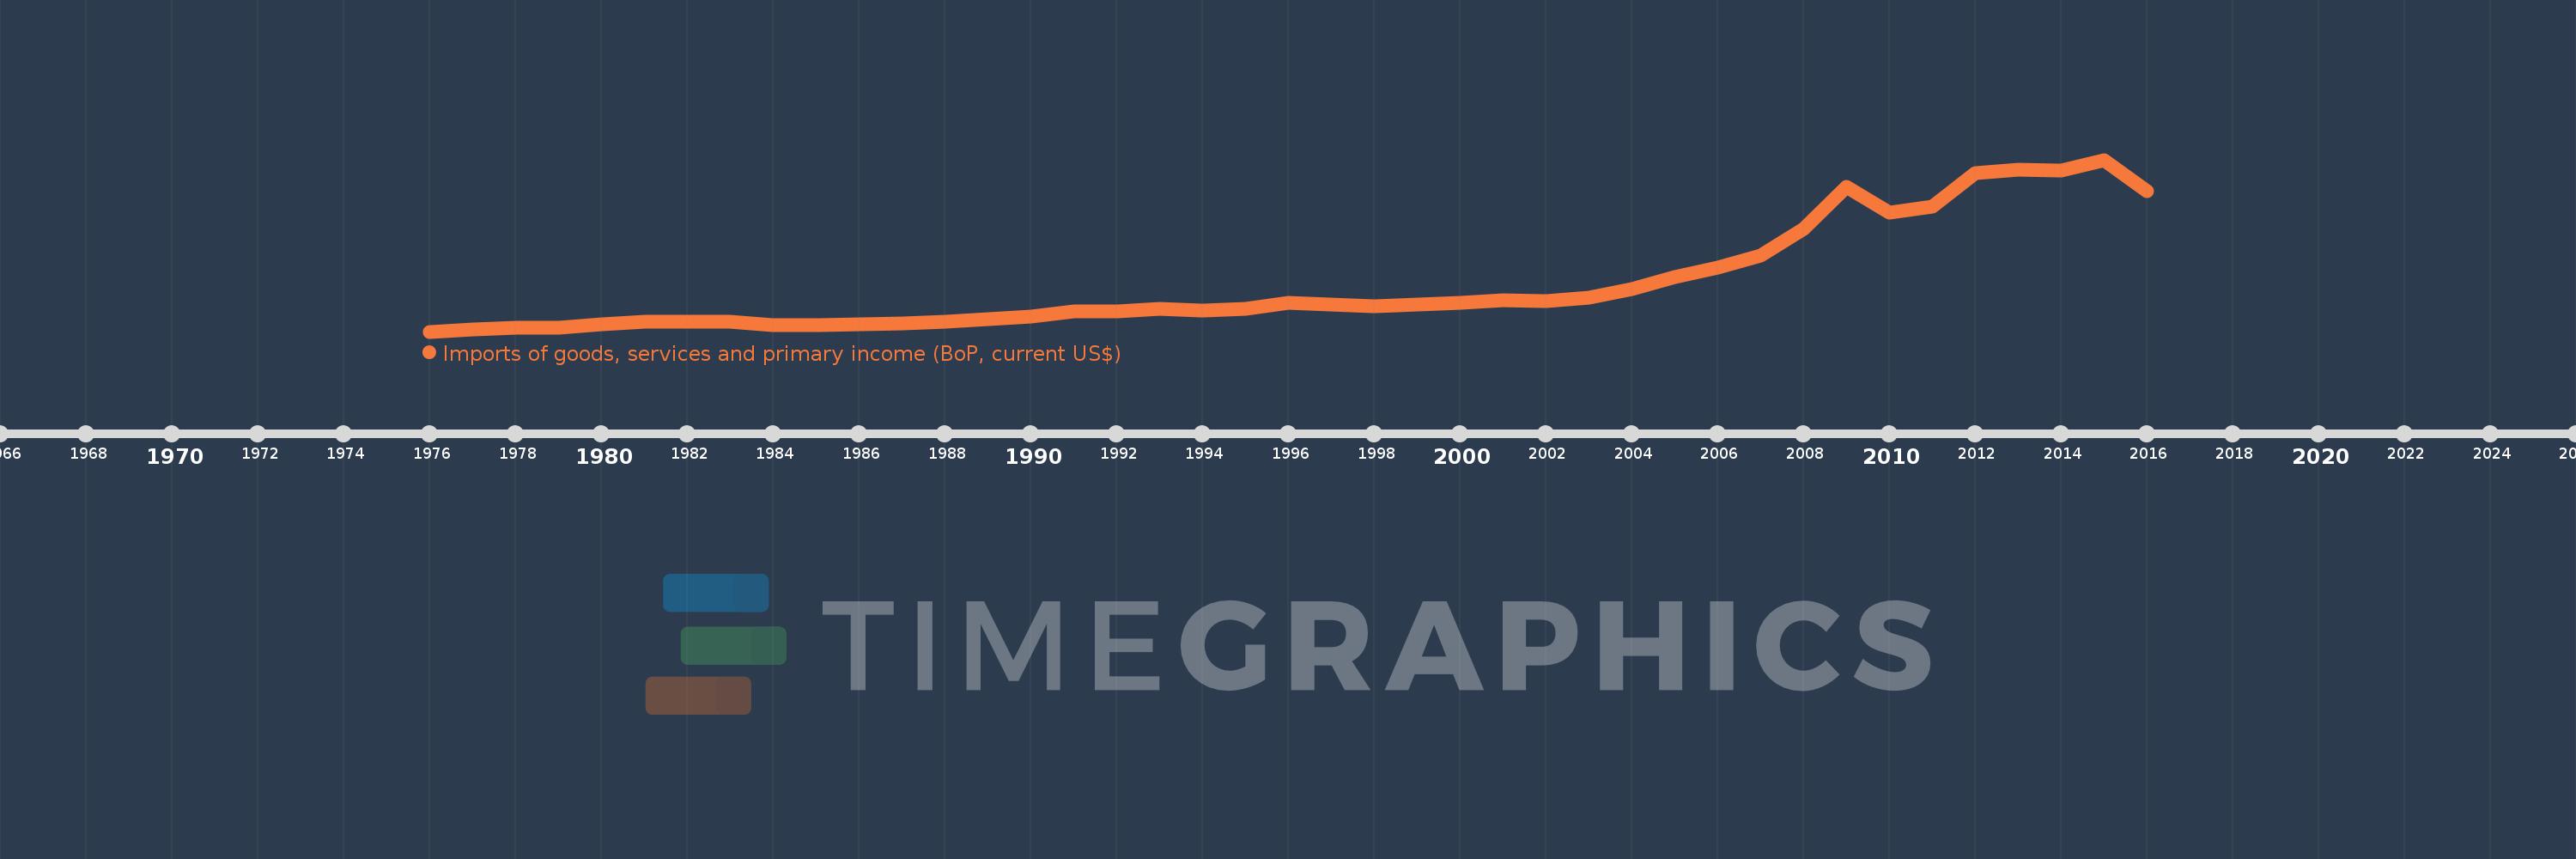
Imports of goods, services and primary income (BoP, current US$)
2016,2015,2014,2013,2012,2011,2010,2009,2008,2007,2006,2005,2004,2003,2002,2001,2000,1999,1998,1997,1996,1995,1994,1993,1992,1991,1990,1989,1988,1987,1986,1985,1984,1983,1982,1981,1980,1979,1978,1977,1976
This statistics in other country:
AfghanistanAlbaniaAlgeriaAngolaAntigua and BarbudaArab WorldArgentinaArmeniaArubaAustraliaAustriaAzerbaijanBahamas, TheBahrainBangladeshBarbadosBelarusBelgiumBelizeBeninBermudaBhutanBoliviaBosnia and HerzegovinaBotswanaBrazilBrunei DarussalamBulgariaBurkina FasoBurundiCabo VerdeCambodiaCameroonCanadaCaribbean small statesCentral African RepublicCentral Europe and the BalticsChadChileChinaColombiaComorosCongo, Dem. Rep.Congo, Rep.Costa RicaCote d'IvoireCroatiaCuracaoCyprusCzech RepublicDenmarkDjiboutiDominicaDominican RepublicEarly-demographic dividendEast Asia & PacificEast Asia & Pacific (excluding high income)East Asia & Pacific (IDA & IBRD countries)EcuadorEgypt, Arab Rep.El SalvadorEquatorial GuineaEritreaEstoniaEthiopiaEuro areaEurope & Central AsiaEurope & Central Asia (excluding high income)Europe & Central Asia (IDA & IBRD countries)European UnionFaroe IslandsFijiFinlandFragile and conflict affected situationsFranceFrench PolynesiaGabonGambia, TheGeorgiaGermanyGhanaGreeceGrenadaGuatemalaGuineaGuinea-BissauGuyanaHaitiHeavily indebted poor countries (HIPC)High incomeHondurasHong Kong SAR, ChinaHungaryIBRD onlyIcelandIDA & IBRD totalIDA blendIDA onlyIDA totalIndiaIndonesiaIran, Islamic Rep.IraqIrelandIsraelItalyJamaicaJapanJordanKazakhstanKenyaKiribatiKorea, Rep.KosovoKuwaitKyrgyz RepublicLao PDRLate-demographic dividendLatin America & Caribbean Latin America & Caribbean (excluding high income)Latin America & the Caribbean (IDA & IBRD countries)LatviaLeast developed countries: UN classificationLebanonLesothoLiberiaLibyaLithuaniaLow & middle incomeLow incomeLower middle incomeLuxembourgMacao SAR, ChinaMacedonia, FYRMadagascarMalawiMalaysiaMaldivesMaliMaltaMarshall IslandsMauritaniaMauritiusMexicoMicronesia, Fed. Sts.Middle East & North Africa (excluding high income)Middle East & North Africa (IDA & IBRD countries)Middle incomeMoldovaMongoliaMontenegroMoroccoMozambiqueMyanmarNamibiaNepalNetherlandsNew CaledoniaNicaraguaNigerNigeriaNorth AmericaNorwayOECD membersOmanOther small statesPacific island small statesPakistanPalauPanamaPapua New GuineaParaguayPeruPhilippinesPolandPortugalPost-demographic dividendPre-demographic dividendQatarRomaniaRussian FederationRwandaSamoaSao Tome and PrincipeSaudi ArabiaSenegalSerbiaSeychellesSierra LeoneSingaporeSint Maarten (Dutch part)Slovak RepublicSloveniaSmall statesSolomon IslandsSouth AfricaSouth AsiaSouth Asia (IDA & IBRD)South SudanSpainSri LankaSt. Kitts and NevisSt. LuciaSt. Vincent and the GrenadinesSub-Saharan Africa Sub-Saharan Africa (excluding high income)Sub-Saharan Africa (IDA & IBRD countries)SudanSurinameSwazilandSwedenSwitzerlandSyrian Arab RepublicTajikistanTanzaniaThailandTimor-LesteTogoTongaTrinidad and TobagoTunisiaTurkeyTuvaluUgandaUkraineUnited KingdomUnited StatesUpper middle incomeUruguayVanuatuVenezuela, RBVietnamWest Bank and GazaWorldYemen, Rep.ZambiaZimbabwe Timeline:
This timeline shows a graph from 1976 to 2016 of Morocco. No data until 1975. Number of actual observations by date: 41.
Source name:
World Development Indicators
Source organization:
International Monetary Fund, Balance of Payments Statistics Yearbook and data files.
Categories, topics:
Economy & Growth, External Debt, Trade
Last updated:
apr 23, 2017
Indicators value changes by year
Minimum:
3.056 bln
jan 1, 1976
Maximum:
52.707 bln
jan 1, 2015
At the date of observation
Value
Absolute change
Change from previous value
jan 1, 1976
3.056 bln
+3.056 bln
0.0%
jan 1, 1977
3.602 bln
+545.873 mln
17.86%
jan 1, 1978
4.265 bln
+662.99 mln
18.41%
jan 1, 1979
4.247 bln
-18.045 mln
-0.42%
jan 1, 1980
5.164 bln
+917.502 mln
21.61%
jan 1, 1981
5.807 bln
+642.921 mln
12.45%
jan 1, 1982
6.014 bln
+206.905 mln
3.56%
jan 1, 1983
5.824 bln
-189.646 mln
-3.15%
jan 1, 1984
4.809 bln
-1.016 bln
-17.44%
jan 1, 1985
4.943 bln
+134.315 mln
2.79%
jan 1, 1986
5.125 bln
+182.154 mln
3.69%
jan 1, 1987
5.341 bln
+215.479 mln
4.2%
jan 1, 1988
5.788 bln
+447.001 mln
8.37%
jan 1, 1989
6.545 bln
+757.396 mln
13.09%
jan 1, 1990
7.423 bln
+877.984 mln
13.41%
jan 1, 1991
8.853 bln
+1.43 bln
19.27%
jan 1, 1992
9.005 bln
+151.723 mln
1.71%
jan 1, 1993
9.635 bln
+630.238 mln
7.0%
jan 1, 1994
9.107 bln
-528.212 mln
-5.48%
jan 1, 1995
9.675 bln
+567.898 mln
6.24%
jan 1, 1996
11.334 bln
+1.659 bln
17.15%
jan 1, 1997
10.908 bln
-425.272 mln
-3.75%
jan 1, 1998
10.328 bln
-580.566 mln
-5.32%
jan 1, 1999
10.962 bln
+634.456 mln
6.14%
jan 1, 2000
11.325 bln
+362.85 mln
3.31%
jan 1, 2001
12.085 bln
+759.561 mln
6.71%
jan 1, 2002
11.818 bln
-266.818 mln
-2.21%
jan 1, 2003
12.753 bln
+934.89 mln
7.91%
jan 1, 2004
15.225 bln
+2.472 bln
19.38%
jan 1, 2005
18.902 bln
+3.677 bln
24.15%
jan 1, 2006
21.616 bln
+2.714 bln
14.36%
jan 1, 2007
25.083 bln
+3.467 bln
16.04%
jan 1, 2008
32.736 bln
+7.653 bln
30.51%
jan 1, 2009
44.91 bln
+12.174 bln
37.19%
jan 1, 2010
37.346 bln
-7.563 bln
-16.84%
jan 1, 2011
39.109 bln
+1.763 bln
4.72%
jan 1, 2012
48.764 bln
+9.655 bln
24.69%
jan 1, 2013
49.913 bln
+1.149 bln
2.36%
jan 1, 2014
49.667 bln
-245.206 mln
-0.49%
jan 1, 2015
52.707 bln
+3.04 bln
6.12%
jan 1, 2016
43.624 bln
-9.083 bln
-17.23%
Ranking of countries by current statistics by years


Comments: