29
/
en
AIzaSyAYiBZKx7MnpbEhh9jyipgxe19OcubqV5w
April 1, 2024
28215
East Asia & Pacific (excluding high income)
EAP
false
2
1
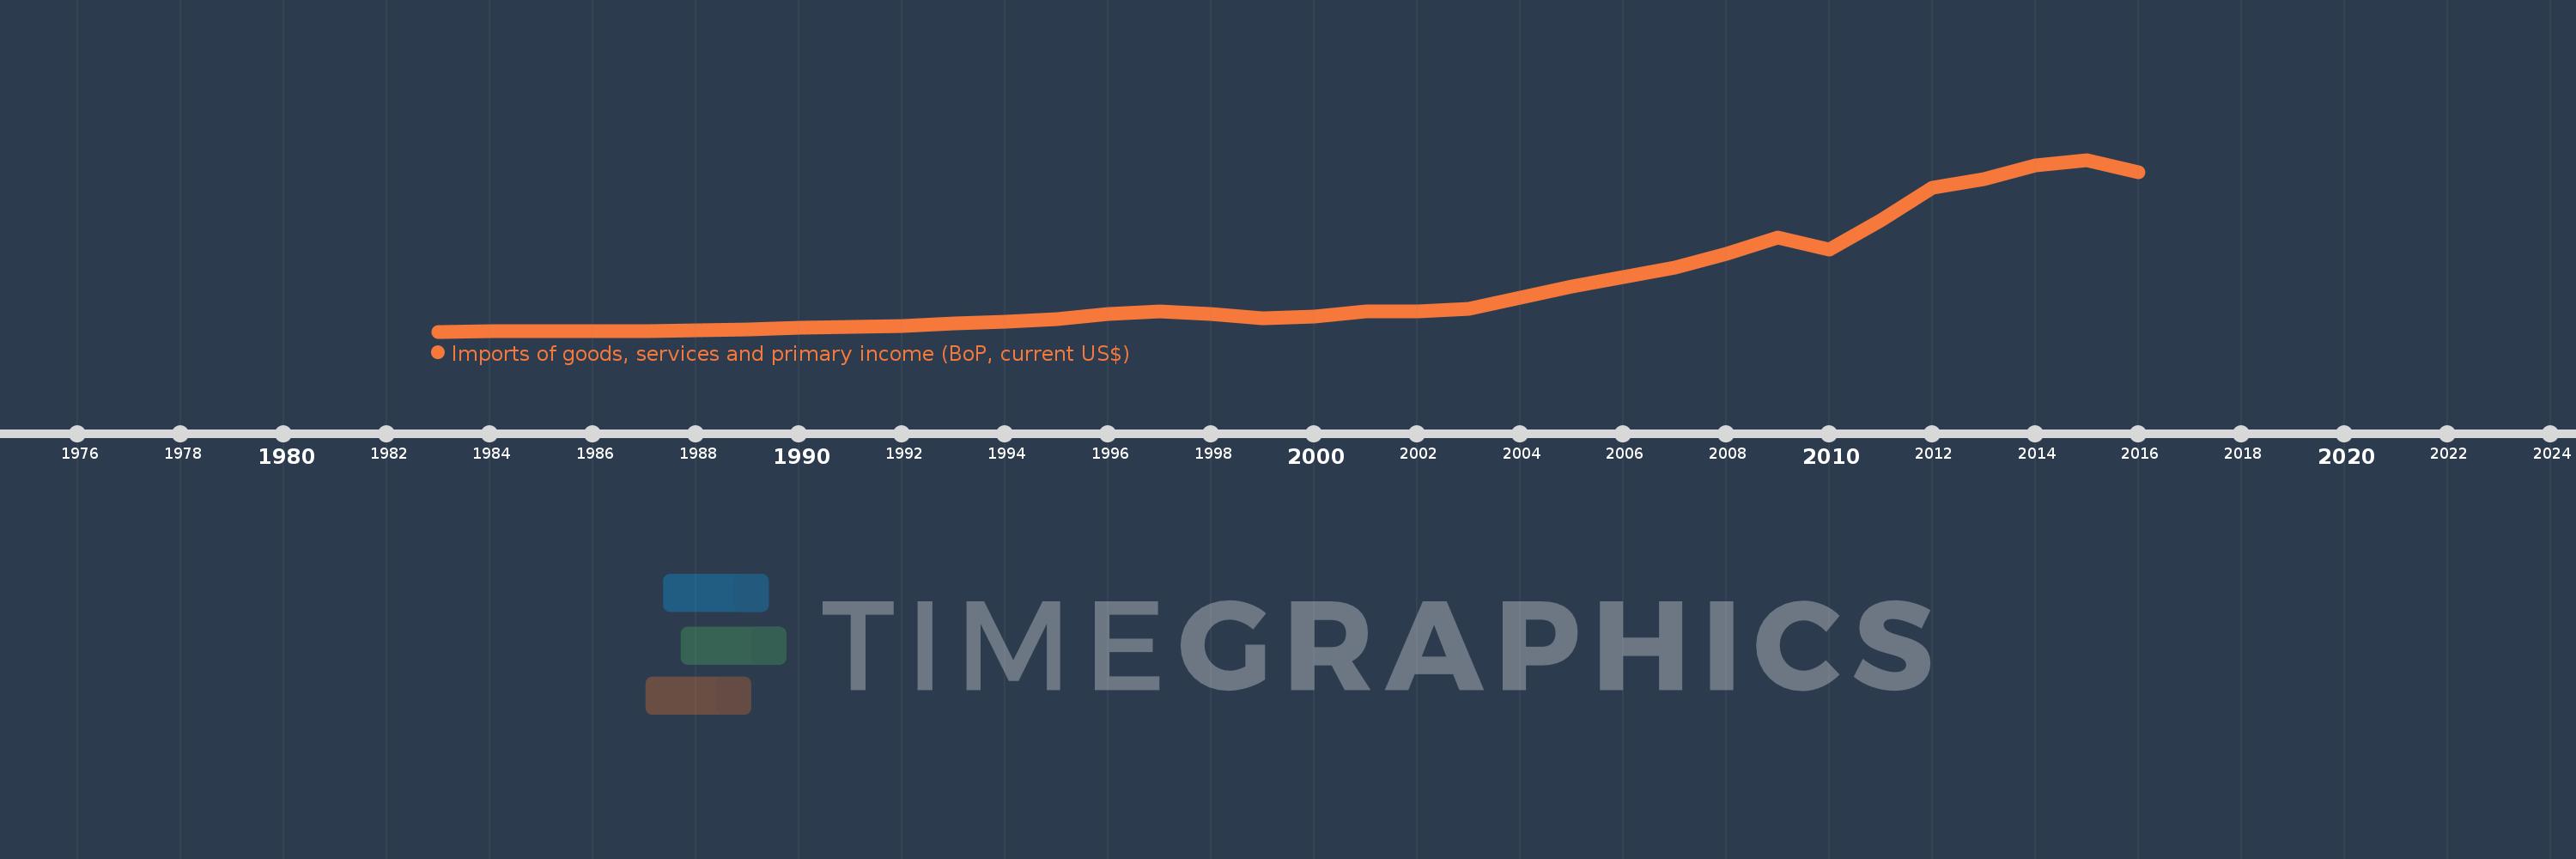
Imports of goods, services and primary income (BoP, current US$)
2016,2015,2014,2013,2012,2011,2010,2009,2008,2007,2006,2005,2004,2003,2002,2001,2000,1999,1998,1997,1996,1995,1994,1993,1992,1991,1990,1989,1988,1987,1986,1985,1984,1983
This statistics in other country:
AfghanistanAlbaniaAlgeriaAngolaAntigua and BarbudaArab WorldArgentinaArmeniaArubaAustraliaAustriaAzerbaijanBahamas, TheBahrainBangladeshBarbadosBelarusBelgiumBelizeBeninBermudaBhutanBoliviaBosnia and HerzegovinaBotswanaBrazilBrunei DarussalamBulgariaBurkina FasoBurundiCabo VerdeCambodiaCameroonCanadaCaribbean small statesCentral African RepublicCentral Europe and the BalticsChadChileChinaColombiaComorosCongo, Dem. Rep.Congo, Rep.Costa RicaCote d'IvoireCroatiaCuracaoCyprusCzech RepublicDenmarkDjiboutiDominicaDominican RepublicEarly-demographic dividendEast Asia & PacificEast Asia & Pacific (excluding high income)East Asia & Pacific (IDA & IBRD countries)EcuadorEgypt, Arab Rep.El SalvadorEquatorial GuineaEritreaEstoniaEthiopiaEuro areaEurope & Central AsiaEurope & Central Asia (excluding high income)Europe & Central Asia (IDA & IBRD countries)European UnionFaroe IslandsFijiFinlandFragile and conflict affected situationsFranceFrench PolynesiaGabonGambia, TheGeorgiaGermanyGhanaGreeceGrenadaGuatemalaGuineaGuinea-BissauGuyanaHaitiHeavily indebted poor countries (HIPC)High incomeHondurasHong Kong SAR, ChinaHungaryIBRD onlyIcelandIDA & IBRD totalIDA blendIDA onlyIDA totalIndiaIndonesiaIran, Islamic Rep.IraqIrelandIsraelItalyJamaicaJapanJordanKazakhstanKenyaKiribatiKorea, Rep.KosovoKuwaitKyrgyz RepublicLao PDRLate-demographic dividendLatin America & Caribbean Latin America & Caribbean (excluding high income)Latin America & the Caribbean (IDA & IBRD countries)LatviaLeast developed countries: UN classificationLebanonLesothoLiberiaLibyaLithuaniaLow & middle incomeLow incomeLower middle incomeLuxembourgMacao SAR, ChinaMacedonia, FYRMadagascarMalawiMalaysiaMaldivesMaliMaltaMarshall IslandsMauritaniaMauritiusMexicoMicronesia, Fed. Sts.Middle East & North Africa (excluding high income)Middle East & North Africa (IDA & IBRD countries)Middle incomeMoldovaMongoliaMontenegroMoroccoMozambiqueMyanmarNamibiaNepalNetherlandsNew CaledoniaNicaraguaNigerNigeriaNorth AmericaNorwayOECD membersOmanOther small statesPacific island small statesPakistanPalauPanamaPapua New GuineaParaguayPeruPhilippinesPolandPortugalPost-demographic dividendPre-demographic dividendQatarRomaniaRussian FederationRwandaSamoaSao Tome and PrincipeSaudi ArabiaSenegalSerbiaSeychellesSierra LeoneSingaporeSint Maarten (Dutch part)Slovak RepublicSloveniaSmall statesSolomon IslandsSouth AfricaSouth AsiaSouth Asia (IDA & IBRD)South SudanSpainSri LankaSt. Kitts and NevisSt. LuciaSt. Vincent and the GrenadinesSub-Saharan Africa Sub-Saharan Africa (excluding high income)Sub-Saharan Africa (IDA & IBRD countries)SudanSurinameSwazilandSwedenSwitzerlandSyrian Arab RepublicTajikistanTanzaniaThailandTimor-LesteTogoTongaTrinidad and TobagoTunisiaTurkeyTuvaluUgandaUkraineUnited KingdomUnited StatesUpper middle incomeUruguayVanuatuVenezuela, RBVietnamWest Bank and GazaWorldYemen, Rep.ZambiaZimbabwe Timeline:
This timeline shows a graph from 1983 to 2016 of East Asia & Pacific (excluding high income). No data until 1982. Number of actual observations by date: 34.
Source name:
World Development Indicators
Source organization:
International Monetary Fund, Balance of Payments Statistics Yearbook and data files.
Categories, topics:
Economy & Growth, External Debt, Trade
Last updated:
apr 23, 2017
Indicators value changes by year
Minimum:
94.535 bln
jan 1, 1983
Maximum:
3.574 trl
jan 1, 2015
At the date of observation
Value
Absolute change
Change from previous value
jan 1, 1983
94.535 bln
+94.535 bln
0.0%
jan 1, 1984
98.714 bln
+4.179 bln
4.42%
jan 1, 1985
102.276 bln
+3.562 bln
3.61%
jan 1, 1986
110.027 bln
+7.751 bln
7.58%
jan 1, 1987
103.253 bln
-6.774 bln
-6.16%
jan 1, 1988
115.2 bln
+11.948 bln
11.57%
jan 1, 1989
143.088 bln
+27.888 bln
24.21%
jan 1, 1990
165.185 bln
+22.097 bln
15.44%
jan 1, 1991
183.374 bln
+18.189 bln
11.01%
jan 1, 1992
212.334 bln
+28.959 bln
15.79%
jan 1, 1993
251.407 bln
+39.074 bln
18.4%
jan 1, 1994
300.886 bln
+49.479 bln
19.68%
jan 1, 1995
354.75 bln
+53.863 bln
17.9%
jan 1, 1996
453.326 bln
+98.576 bln
27.79%
jan 1, 1997
497.243 bln
+43.917 bln
9.69%
jan 1, 1998
444.148 bln
-53.096 bln
-10.68%
jan 1, 1999
369.223 bln
-74.925 bln
-16.87%
jan 1, 2000
401.696 bln
+32.474 bln
8.8%
jan 1, 2001
504.743 bln
+103.047 bln
25.65%
jan 1, 2002
505.989 bln
+1.245 bln
0.25%
jan 1, 2003
548.704 bln
+42.715 bln
8.44%
jan 1, 2004
783.062 bln
+234.358 bln
42.71%
jan 1, 2005
1.002 trl
+218.482 bln
27.9%
jan 1, 2006
1.201 trl
+199.531 bln
19.92%
jan 1, 2007
1.393 trl
+192.351 bln
16.01%
jan 1, 2008
1.661 trl
+267.767 bln
19.22%
jan 1, 2009
1.994 trl
+332.886 bln
20.04%
jan 1, 2010
1.761 trl
-232.61 bln
-11.67%
jan 1, 2011
2.348 trl
+586.82 bln
33.31%
jan 1, 2012
3.007 trl
+659.177 bln
28.07%
jan 1, 2013
3.182 trl
+174.531 bln
5.8%
jan 1, 2014
3.468 trl
+286.079 bln
8.99%
jan 1, 2015
3.574 trl
+105.547 bln
3.04%
jan 1, 2016
3.319 trl
-254.279 bln
-7.12%
Ranking of countries by current statistics by years


Comments: