29
/
en
AIzaSyAYiBZKx7MnpbEhh9jyipgxe19OcubqV5w
April 1, 2024
177784
Lesotho
LSO
true
2
1
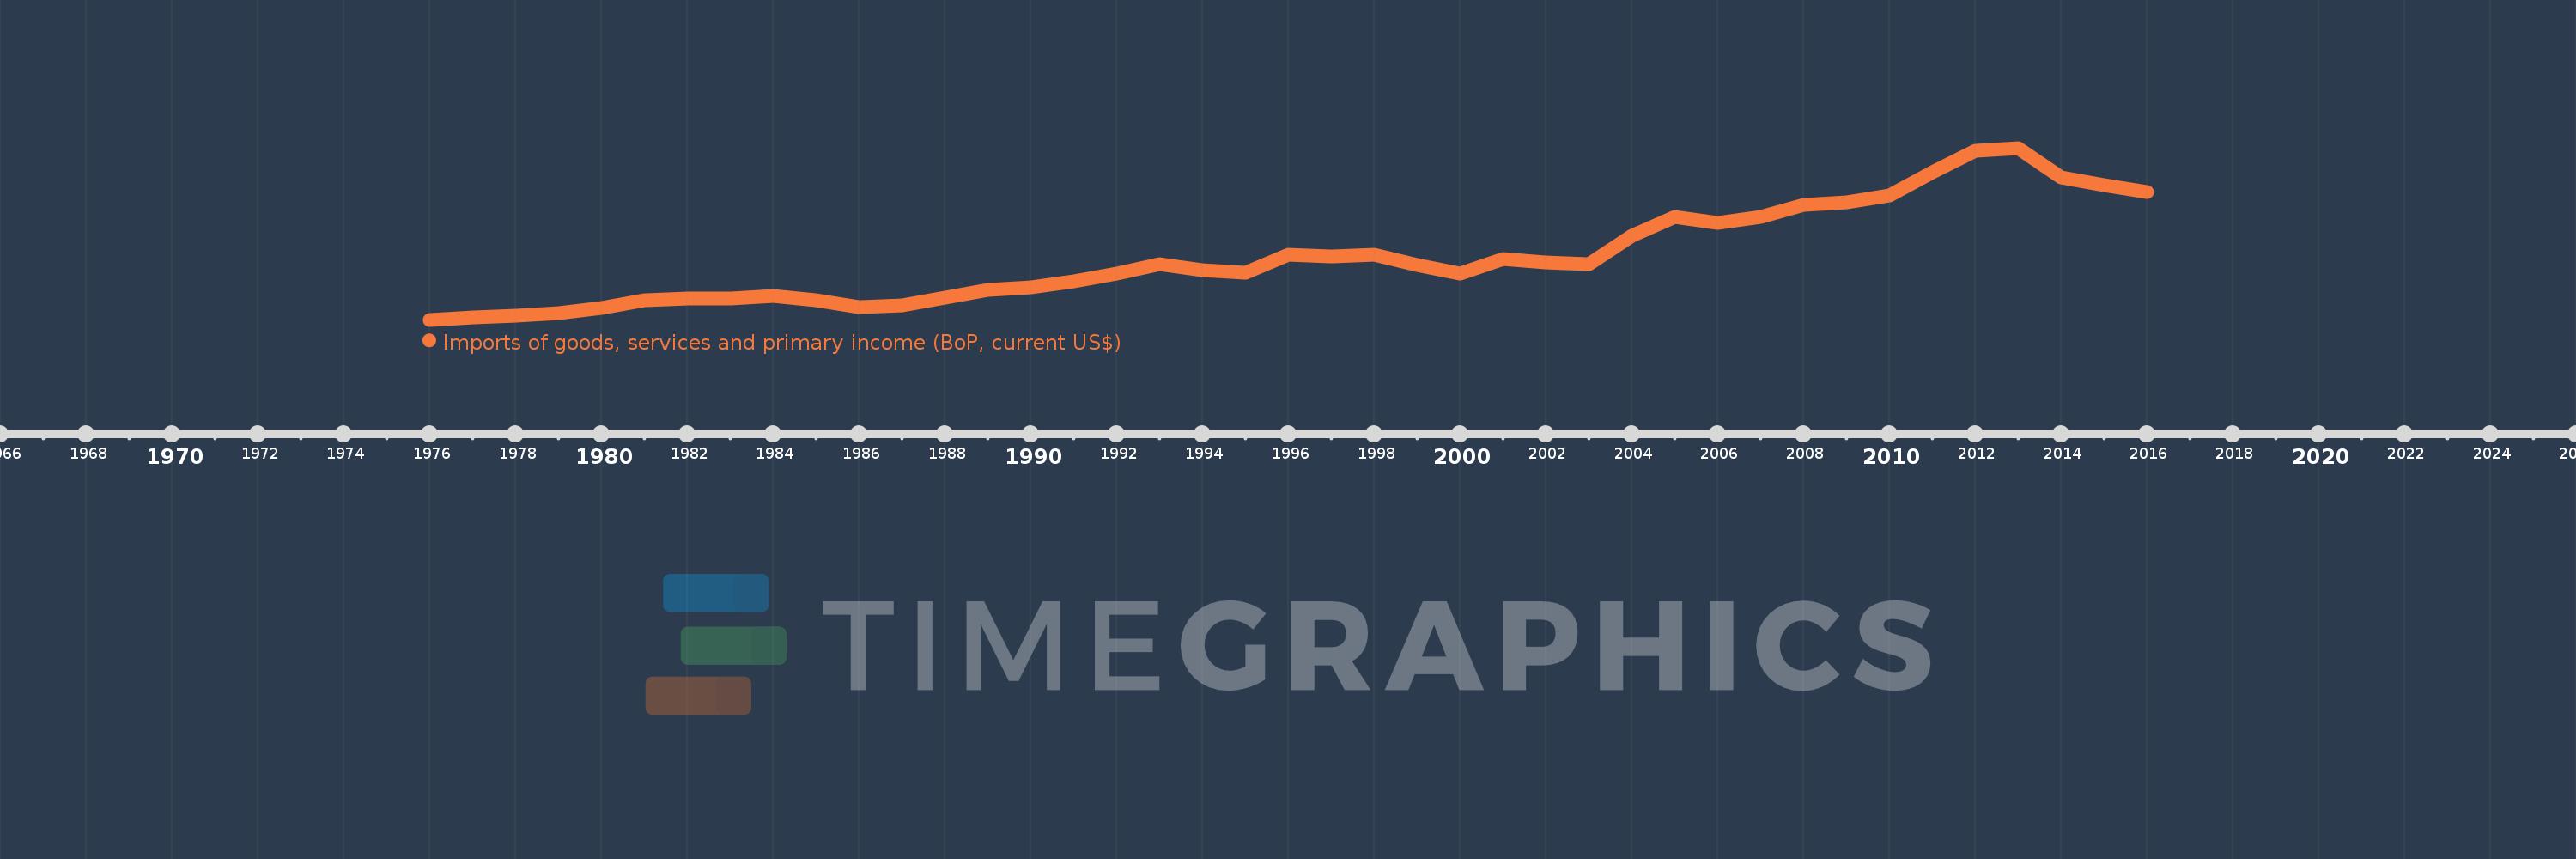
Imports of goods, services and primary income (BoP, current US$)
2016,2015,2014,2013,2012,2011,2010,2009,2008,2007,2006,2005,2004,2003,2002,2001,2000,1999,1998,1997,1996,1995,1994,1993,1992,1991,1990,1989,1988,1987,1986,1985,1984,1983,1982,1981,1980,1979,1978,1977,1976
This statistics in other country:
AfghanistanAlbaniaAlgeriaAngolaAntigua and BarbudaArab WorldArgentinaArmeniaArubaAustraliaAustriaAzerbaijanBahamas, TheBahrainBangladeshBarbadosBelarusBelgiumBelizeBeninBermudaBhutanBoliviaBosnia and HerzegovinaBotswanaBrazilBrunei DarussalamBulgariaBurkina FasoBurundiCabo VerdeCambodiaCameroonCanadaCaribbean small statesCentral African RepublicCentral Europe and the BalticsChadChileChinaColombiaComorosCongo, Dem. Rep.Congo, Rep.Costa RicaCote d'IvoireCroatiaCuracaoCyprusCzech RepublicDenmarkDjiboutiDominicaDominican RepublicEarly-demographic dividendEast Asia & PacificEast Asia & Pacific (excluding high income)East Asia & Pacific (IDA & IBRD countries)EcuadorEgypt, Arab Rep.El SalvadorEquatorial GuineaEritreaEstoniaEthiopiaEuro areaEurope & Central AsiaEurope & Central Asia (excluding high income)Europe & Central Asia (IDA & IBRD countries)European UnionFaroe IslandsFijiFinlandFragile and conflict affected situationsFranceFrench PolynesiaGabonGambia, TheGeorgiaGermanyGhanaGreeceGrenadaGuatemalaGuineaGuinea-BissauGuyanaHaitiHeavily indebted poor countries (HIPC)High incomeHondurasHong Kong SAR, ChinaHungaryIBRD onlyIcelandIDA & IBRD totalIDA blendIDA onlyIDA totalIndiaIndonesiaIran, Islamic Rep.IraqIrelandIsraelItalyJamaicaJapanJordanKazakhstanKenyaKiribatiKorea, Rep.KosovoKuwaitKyrgyz RepublicLao PDRLate-demographic dividendLatin America & Caribbean Latin America & Caribbean (excluding high income)Latin America & the Caribbean (IDA & IBRD countries)LatviaLeast developed countries: UN classificationLebanonLesothoLiberiaLibyaLithuaniaLow & middle incomeLow incomeLower middle incomeLuxembourgMacao SAR, ChinaMacedonia, FYRMadagascarMalawiMalaysiaMaldivesMaliMaltaMarshall IslandsMauritaniaMauritiusMexicoMicronesia, Fed. Sts.Middle East & North Africa (excluding high income)Middle East & North Africa (IDA & IBRD countries)Middle incomeMoldovaMongoliaMontenegroMoroccoMozambiqueMyanmarNamibiaNepalNetherlandsNew CaledoniaNicaraguaNigerNigeriaNorth AmericaNorwayOECD membersOmanOther small statesPacific island small statesPakistanPalauPanamaPapua New GuineaParaguayPeruPhilippinesPolandPortugalPost-demographic dividendPre-demographic dividendQatarRomaniaRussian FederationRwandaSamoaSao Tome and PrincipeSaudi ArabiaSenegalSerbiaSeychellesSierra LeoneSingaporeSint Maarten (Dutch part)Slovak RepublicSloveniaSmall statesSolomon IslandsSouth AfricaSouth AsiaSouth Asia (IDA & IBRD)South SudanSpainSri LankaSt. Kitts and NevisSt. LuciaSt. Vincent and the GrenadinesSub-Saharan Africa Sub-Saharan Africa (excluding high income)Sub-Saharan Africa (IDA & IBRD countries)SudanSurinameSwazilandSwedenSwitzerlandSyrian Arab RepublicTajikistanTanzaniaThailandTimor-LesteTogoTongaTrinidad and TobagoTunisiaTurkeyTuvaluUgandaUkraineUnited KingdomUnited StatesUpper middle incomeUruguayVanuatuVenezuela, RBVietnamWest Bank and GazaWorldYemen, Rep.ZambiaZimbabwe Timeline:
This timeline shows a graph from 1976 to 2016 of Lesotho. No data until 1975. Number of actual observations by date: 41.
Source name:
World Development Indicators
Source organization:
International Monetary Fund, Balance of Payments Statistics Yearbook and data files.
Categories, topics:
Economy & Growth, External Debt, Trade
Last updated:
apr 23, 2017
Indicators value changes by year
Minimum:
174.981 mln
jan 1, 1976
Maximum:
2.888 bln
jan 1, 2013
At the date of observation
Value
Absolute change
Change from previous value
jan 1, 1976
174.981 mln
+174.981 mln
0.0%
jan 1, 1977
214.475 mln
+39.494 mln
22.57%
jan 1, 1978
240.695 mln
+26.22 mln
12.23%
jan 1, 1979
278.76 mln
+38.065 mln
15.81%
jan 1, 1980
358.066 mln
+79.306 mln
28.45%
jan 1, 1981
482.388 mln
+124.322 mln
34.72%
jan 1, 1982
512.918 mln
+30.53 mln
6.33%
jan 1, 1983
508.733 mln
-4.185 mln
-0.82%
jan 1, 1984
545.211 mln
+36.479 mln
7.17%
jan 1, 1985
489.393 mln
-55.819 mln
-10.24%
jan 1, 1986
368.533 mln
-120.86 mln
-24.7%
jan 1, 1987
398.056 mln
+29.523 mln
8.01%
jan 1, 1988
527.233 mln
+129.177 mln
32.45%
jan 1, 1989
643.408 mln
+116.175 mln
22.03%
jan 1, 1990
683.784 mln
+40.376 mln
6.28%
jan 1, 1991
775.91 mln
+92.126 mln
13.47%
jan 1, 1992
907.931 mln
+132.021 mln
17.02%
jan 1, 1993
1.048 bln
+140.021 mln
15.42%
jan 1, 1994
961.336 mln
-86.616 mln
-8.27%
jan 1, 1995
913.833 mln
-47.502 mln
-4.94%
jan 1, 1996
1.204 bln
+289.93 mln
31.73%
jan 1, 1997
1.174 bln
-29.704 mln
-2.47%
jan 1, 1998
1.202 bln
+27.933 mln
2.38%
jan 1, 1999
1.042 bln
-160.193 mln
-13.33%
jan 1, 2000
909.829 mln
-131.97 mln
-12.67%
jan 1, 2001
1.136 bln
+226.629 mln
24.91%
jan 1, 2002
1.086 bln
-50.807 mln
-4.47%
jan 1, 2003
1.059 bln
-26.663 mln
-2.46%
jan 1, 2004
1.504 bln
+445.474 mln
42.07%
jan 1, 2005
1.798 bln
+293.217 mln
19.49%
jan 1, 2006
1.702 bln
-95.504 mln
-5.31%
jan 1, 2007
1.796 bln
+93.977 mln
5.52%
jan 1, 2008
1.989 bln
+192.593 mln
10.72%
jan 1, 2009
2.035 bln
+46.034 mln
2.31%
jan 1, 2010
2.138 bln
+103.709 mln
5.1%
jan 1, 2011
2.5 bln
+361.018 mln
16.88%
jan 1, 2012
2.839 bln
+339.89 mln
13.6%
jan 1, 2013
2.888 bln
+48.833 mln
1.72%
jan 1, 2014
2.424 bln
-464.304 mln
-16.08%
jan 1, 2015
2.307 bln
-117.119 mln
-4.83%
jan 1, 2016
2.188 bln
-118.954 mln
-5.16%
Ranking of countries by current statistics by years


Comments: