29
/
en
AIzaSyAYiBZKx7MnpbEhh9jyipgxe19OcubqV5w
April 1, 2024
148060
Guyana
GUY
true
2
1
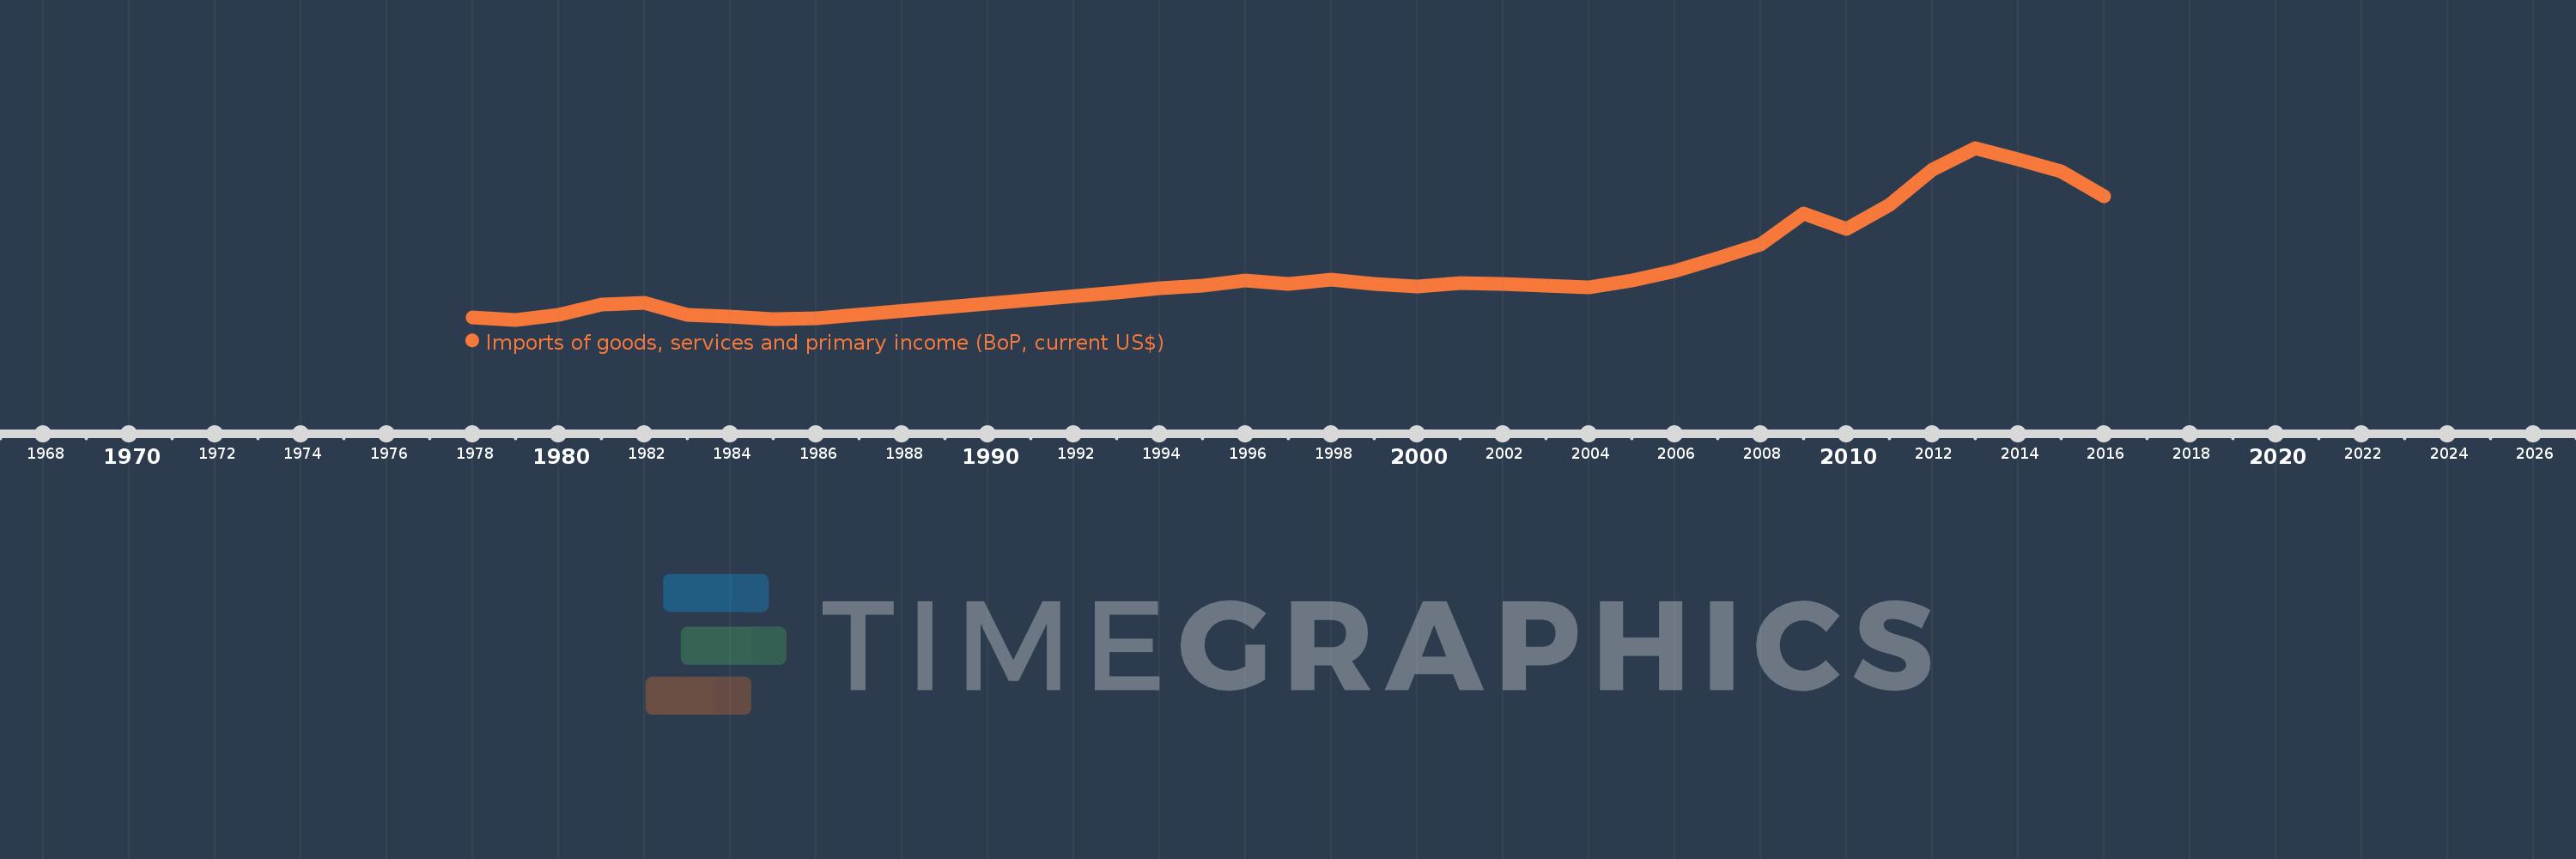
Imports of goods, services and primary income (BoP, current US$)
2016,2015,2014,2013,2012,2011,2010,2009,2008,2007,2006,2005,2004,2003,2002,2001,2000,1999,1998,1997,1996,1995,1994,1993,1986,1985,1984,1983,1982,1981,1980,1979,1978
This statistics in other country:
AfghanistanAlbaniaAlgeriaAngolaAntigua and BarbudaArab WorldArgentinaArmeniaArubaAustraliaAustriaAzerbaijanBahamas, TheBahrainBangladeshBarbadosBelarusBelgiumBelizeBeninBermudaBhutanBoliviaBosnia and HerzegovinaBotswanaBrazilBrunei DarussalamBulgariaBurkina FasoBurundiCabo VerdeCambodiaCameroonCanadaCaribbean small statesCentral African RepublicCentral Europe and the BalticsChadChileChinaColombiaComorosCongo, Dem. Rep.Congo, Rep.Costa RicaCote d'IvoireCroatiaCuracaoCyprusCzech RepublicDenmarkDjiboutiDominicaDominican RepublicEarly-demographic dividendEast Asia & PacificEast Asia & Pacific (excluding high income)East Asia & Pacific (IDA & IBRD countries)EcuadorEgypt, Arab Rep.El SalvadorEquatorial GuineaEritreaEstoniaEthiopiaEuro areaEurope & Central AsiaEurope & Central Asia (excluding high income)Europe & Central Asia (IDA & IBRD countries)European UnionFaroe IslandsFijiFinlandFragile and conflict affected situationsFranceFrench PolynesiaGabonGambia, TheGeorgiaGermanyGhanaGreeceGrenadaGuatemalaGuineaGuinea-BissauGuyanaHaitiHeavily indebted poor countries (HIPC)High incomeHondurasHong Kong SAR, ChinaHungaryIBRD onlyIcelandIDA & IBRD totalIDA blendIDA onlyIDA totalIndiaIndonesiaIran, Islamic Rep.IraqIrelandIsraelItalyJamaicaJapanJordanKazakhstanKenyaKiribatiKorea, Rep.KosovoKuwaitKyrgyz RepublicLao PDRLate-demographic dividendLatin America & Caribbean Latin America & Caribbean (excluding high income)Latin America & the Caribbean (IDA & IBRD countries)LatviaLeast developed countries: UN classificationLebanonLesothoLiberiaLibyaLithuaniaLow & middle incomeLow incomeLower middle incomeLuxembourgMacao SAR, ChinaMacedonia, FYRMadagascarMalawiMalaysiaMaldivesMaliMaltaMarshall IslandsMauritaniaMauritiusMexicoMicronesia, Fed. Sts.Middle East & North Africa (excluding high income)Middle East & North Africa (IDA & IBRD countries)Middle incomeMoldovaMongoliaMontenegroMoroccoMozambiqueMyanmarNamibiaNepalNetherlandsNew CaledoniaNicaraguaNigerNigeriaNorth AmericaNorwayOECD membersOmanOther small statesPacific island small statesPakistanPalauPanamaPapua New GuineaParaguayPeruPhilippinesPolandPortugalPost-demographic dividendPre-demographic dividendQatarRomaniaRussian FederationRwandaSamoaSao Tome and PrincipeSaudi ArabiaSenegalSerbiaSeychellesSierra LeoneSingaporeSint Maarten (Dutch part)Slovak RepublicSloveniaSmall statesSolomon IslandsSouth AfricaSouth AsiaSouth Asia (IDA & IBRD)South SudanSpainSri LankaSt. Kitts and NevisSt. LuciaSt. Vincent and the GrenadinesSub-Saharan Africa Sub-Saharan Africa (excluding high income)Sub-Saharan Africa (IDA & IBRD countries)SudanSurinameSwazilandSwedenSwitzerlandSyrian Arab RepublicTajikistanTanzaniaThailandTimor-LesteTogoTongaTrinidad and TobagoTunisiaTurkeyTuvaluUgandaUkraineUnited KingdomUnited StatesUpper middle incomeUruguayVanuatuVenezuela, RBVietnamWest Bank and GazaWorldYemen, Rep.ZambiaZimbabwe Timeline:
This timeline shows a graph from 1978 to 2016 of Guyana. No data until 1977. Number of actual observations by date: 33.
Source name:
World Development Indicators
Source organization:
International Monetary Fund, Balance of Payments Statistics Yearbook and data files.
Categories, topics:
Economy & Growth, External Debt, Trade
Last updated:
apr 23, 2017
Indicators value changes by year
Minimum:
336.863 mln
jan 1, 1979
Maximum:
2.55 bln
jan 1, 2013
At the date of observation
Value
Absolute change
Change from previous value
jan 1, 1978
369.098 mln
+369.098 mln
0.0%
jan 1, 1979
336.863 mln
-32.235 mln
-8.73%
jan 1, 1980
398.235 mln
+61.373 mln
18.22%
jan 1, 1981
538.235 mln
+140.0 mln
35.16%
jan 1, 1982
556.124 mln
+17.889 mln
3.32%
jan 1, 1983
397.911 mln
-158.214 mln
-28.45%
jan 1, 1984
381.688 mln
-16.223 mln
-4.08%
jan 1, 1985
345.634 mln
-36.054 mln
-9.45%
jan 1, 1986
353.429 mln
+7.795 mln
2.26%
jan 1, 1993
684.05 mln
+330.621 mln
93.55%
jan 1, 1994
738.73 mln
+54.68 mln
7.99%
jan 1, 1995
779.71 mln
+40.98 mln
5.55%
jan 1, 1996
838.2 mln
+58.49 mln
7.5%
jan 1, 1997
797.7 mln
-40.5 mln
-4.83%
jan 1, 1998
854.3 mln
+56.6 mln
7.1%
jan 1, 1999
798.4 mln
-55.9 mln
-6.54%
jan 1, 2000
769.0 mln
-29.4 mln
-3.68%
jan 1, 2001
813.1 mln
+44.1 mln
5.73%
jan 1, 2002
802.4 mln
-10.7 mln
-1.32%
jan 1, 2003
772.5 mln
-29.9 mln
-3.73%
jan 1, 2004
757.3 mln
-15.2 mln
-1.97%
jan 1, 2005
842.776 mln
+85.476 mln
11.29%
jan 1, 2006
960.271 mln
+117.495 mln
13.94%
jan 1, 2007
1.127 bln
+166.703 mln
17.36%
jan 1, 2008
1.303 bln
+176.149 mln
15.63%
jan 1, 2009
1.705 bln
+401.741 mln
30.83%
jan 1, 2010
1.509 bln
-196.363 mln
-11.52%
jan 1, 2011
1.814 bln
+305.633 mln
20.26%
jan 1, 2012
2.265 bln
+451.359 mln
24.88%
jan 1, 2013
2.55 bln
+284.433 mln
12.56%
jan 1, 2014
2.403 bln
-147.149 mln
-5.77%
jan 1, 2015
2.246 bln
-156.944 mln
-6.53%
jan 1, 2016
1.931 bln
-315.071 mln
-14.03%
Ranking of countries by current statistics by years


Comments: