29
/
en
AIzaSyAYiBZKx7MnpbEhh9jyipgxe19OcubqV5w
April 1, 2024
59883
Sub-Saharan Africa (excluding high income)
SSA
false
2
1
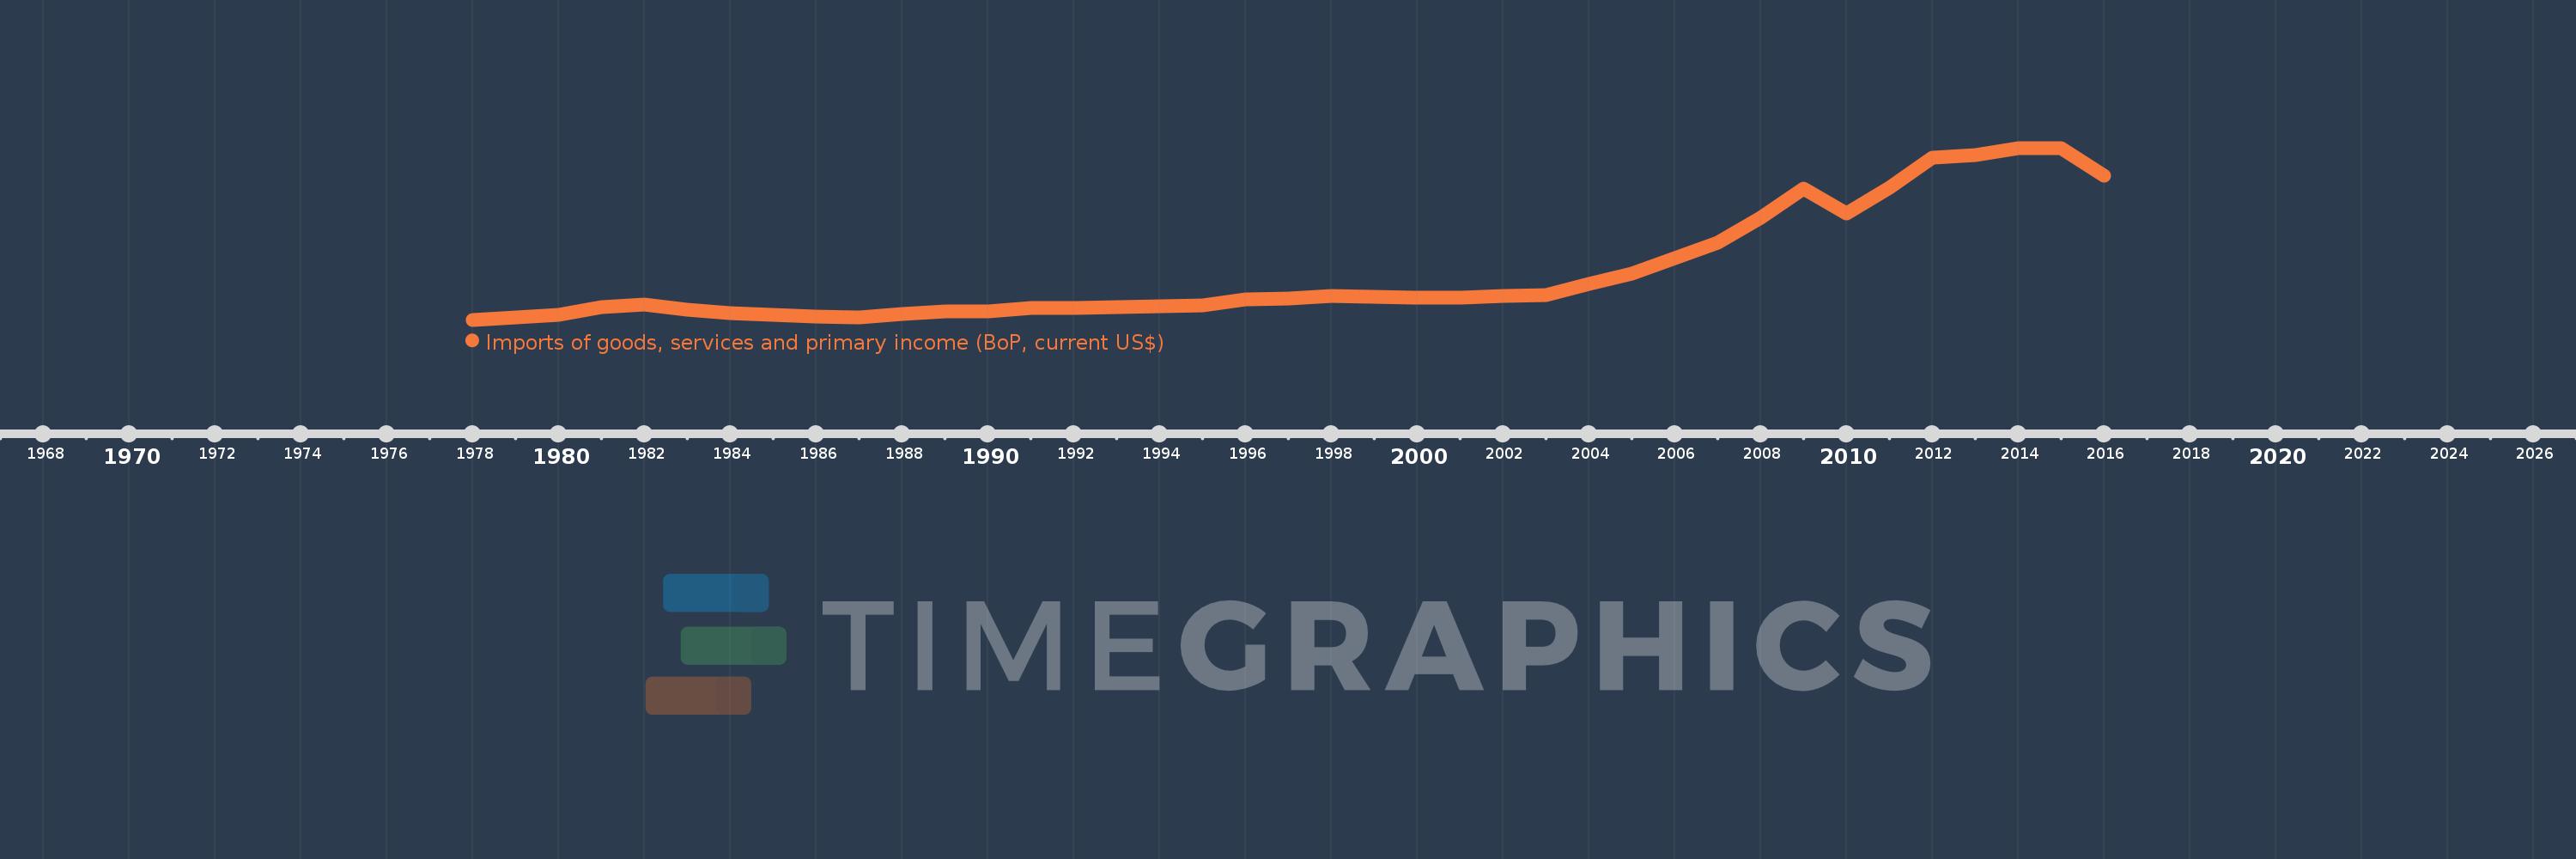
Imports of goods, services and primary income (BoP, current US$)
2016,2015,2014,2013,2012,2011,2010,2009,2008,2007,2006,2005,2004,2003,2002,2001,2000,1999,1998,1997,1996,1995,1994,1993,1992,1991,1990,1989,1988,1987,1986,1985,1984,1983,1982,1981,1980,1979,1978
This statistics in other country:
AfghanistanAlbaniaAlgeriaAngolaAntigua and BarbudaArab WorldArgentinaArmeniaArubaAustraliaAustriaAzerbaijanBahamas, TheBahrainBangladeshBarbadosBelarusBelgiumBelizeBeninBermudaBhutanBoliviaBosnia and HerzegovinaBotswanaBrazilBrunei DarussalamBulgariaBurkina FasoBurundiCabo VerdeCambodiaCameroonCanadaCaribbean small statesCentral African RepublicCentral Europe and the BalticsChadChileChinaColombiaComorosCongo, Dem. Rep.Congo, Rep.Costa RicaCote d'IvoireCroatiaCuracaoCyprusCzech RepublicDenmarkDjiboutiDominicaDominican RepublicEarly-demographic dividendEast Asia & PacificEast Asia & Pacific (excluding high income)East Asia & Pacific (IDA & IBRD countries)EcuadorEgypt, Arab Rep.El SalvadorEquatorial GuineaEritreaEstoniaEthiopiaEuro areaEurope & Central AsiaEurope & Central Asia (excluding high income)Europe & Central Asia (IDA & IBRD countries)European UnionFaroe IslandsFijiFinlandFragile and conflict affected situationsFranceFrench PolynesiaGabonGambia, TheGeorgiaGermanyGhanaGreeceGrenadaGuatemalaGuineaGuinea-BissauGuyanaHaitiHeavily indebted poor countries (HIPC)High incomeHondurasHong Kong SAR, ChinaHungaryIBRD onlyIcelandIDA & IBRD totalIDA blendIDA onlyIDA totalIndiaIndonesiaIran, Islamic Rep.IraqIrelandIsraelItalyJamaicaJapanJordanKazakhstanKenyaKiribatiKorea, Rep.KosovoKuwaitKyrgyz RepublicLao PDRLate-demographic dividendLatin America & Caribbean Latin America & Caribbean (excluding high income)Latin America & the Caribbean (IDA & IBRD countries)LatviaLeast developed countries: UN classificationLebanonLesothoLiberiaLibyaLithuaniaLow & middle incomeLow incomeLower middle incomeLuxembourgMacao SAR, ChinaMacedonia, FYRMadagascarMalawiMalaysiaMaldivesMaliMaltaMarshall IslandsMauritaniaMauritiusMexicoMicronesia, Fed. Sts.Middle East & North Africa (excluding high income)Middle East & North Africa (IDA & IBRD countries)Middle incomeMoldovaMongoliaMontenegroMoroccoMozambiqueMyanmarNamibiaNepalNetherlandsNew CaledoniaNicaraguaNigerNigeriaNorth AmericaNorwayOECD membersOmanOther small statesPacific island small statesPakistanPalauPanamaPapua New GuineaParaguayPeruPhilippinesPolandPortugalPost-demographic dividendPre-demographic dividendQatarRomaniaRussian FederationRwandaSamoaSao Tome and PrincipeSaudi ArabiaSenegalSerbiaSeychellesSierra LeoneSingaporeSint Maarten (Dutch part)Slovak RepublicSloveniaSmall statesSolomon IslandsSouth AfricaSouth AsiaSouth Asia (IDA & IBRD)South SudanSpainSri LankaSt. Kitts and NevisSt. LuciaSt. Vincent and the GrenadinesSub-Saharan Africa Sub-Saharan Africa (excluding high income)Sub-Saharan Africa (IDA & IBRD countries)SudanSurinameSwazilandSwedenSwitzerlandSyrian Arab RepublicTajikistanTanzaniaThailandTimor-LesteTogoTongaTrinidad and TobagoTunisiaTurkeyTuvaluUgandaUkraineUnited KingdomUnited StatesUpper middle incomeUruguayVanuatuVenezuela, RBVietnamWest Bank and GazaWorldYemen, Rep.ZambiaZimbabwe Timeline:
This timeline shows a graph from 1978 to 2016 of Sub-Saharan Africa (excluding high income). No data until 1977. Number of actual observations by date: 39.
Source name:
World Development Indicators
Source organization:
International Monetary Fund, Balance of Payments Statistics Yearbook and data files.
Categories, topics:
Economy & Growth, External Debt, Trade
Last updated:
apr 23, 2017
Indicators value changes by year
Minimum:
49.3 bln
jan 1, 1978
Maximum:
597.432 bln
jan 1, 2014
At the date of observation
Value
Absolute change
Change from previous value
jan 1, 1978
49.3 bln
+49.3 bln
0.0%
jan 1, 1979
56.619 bln
+7.319 bln
14.85%
jan 1, 1980
65.182 bln
+8.563 bln
15.12%
jan 1, 1981
89.866 bln
+24.684 bln
37.87%
jan 1, 1982
97.821 bln
+7.955 bln
8.85%
jan 1, 1983
81.387 bln
-16.434 bln
-16.8%
jan 1, 1984
70.743 bln
-10.643 bln
-13.08%
jan 1, 1985
65.946 bln
-4.798 bln
-6.78%
jan 1, 1986
60.339 bln
-5.606 bln
-8.5%
jan 1, 1987
57.706 bln
-2.634 bln
-4.36%
jan 1, 1988
67.531 bln
+9.825 bln
17.03%
jan 1, 1989
74.997 bln
+7.466 bln
11.06%
jan 1, 1990
76.138 bln
+1.141 bln
1.52%
jan 1, 1991
85.993 bln
+9.855 bln
12.94%
jan 1, 1992
87.732 bln
+1.738 bln
2.02%
jan 1, 1993
90.152 bln
+2.421 bln
2.76%
jan 1, 1994
91.016 bln
+863.248 mln
0.96%
jan 1, 1995
96.299 bln
+5.284 bln
5.81%
jan 1, 1996
114.072 bln
+17.772 bln
18.46%
jan 1, 1997
117.157 bln
+3.085 bln
2.7%
jan 1, 1998
124.765 bln
+7.608 bln
6.49%
jan 1, 1999
123.455 bln
-1.311 bln
-1.05%
jan 1, 2000
120.376 bln
-3.079 bln
-2.49%
jan 1, 2001
120.331 bln
-45.416 mln
-0.04%
jan 1, 2002
125.672 bln
+5.342 bln
4.44%
jan 1, 2003
129.209 bln
+3.537 bln
2.81%
jan 1, 2004
162.695 bln
+33.486 bln
25.92%
jan 1, 2005
196.909 bln
+34.213 bln
21.03%
jan 1, 2006
246.943 bln
+50.034 bln
25.41%
jan 1, 2007
293.855 bln
+46.912 bln
19.0%
jan 1, 2008
375.346 bln
+81.491 bln
27.73%
jan 1, 2009
466.953 bln
+91.607 bln
24.41%
jan 1, 2010
388.036 bln
-78.917 bln
-16.9%
jan 1, 2011
469.991 bln
+81.955 bln
21.12%
jan 1, 2012
566.744 bln
+96.752 bln
20.59%
jan 1, 2013
574.608 bln
+7.865 bln
1.39%
jan 1, 2014
597.432 bln
+22.824 bln
3.97%
jan 1, 2015
596.489 bln
-943.364 mln
-0.16%
jan 1, 2016
509.593 bln
-86.896 bln
-14.57%
Ranking of countries by current statistics by years


Comments: