29
/
en
AIzaSyAYiBZKx7MnpbEhh9jyipgxe19OcubqV5w
April 1, 2024
141930
Greece
GRC
true
2
1
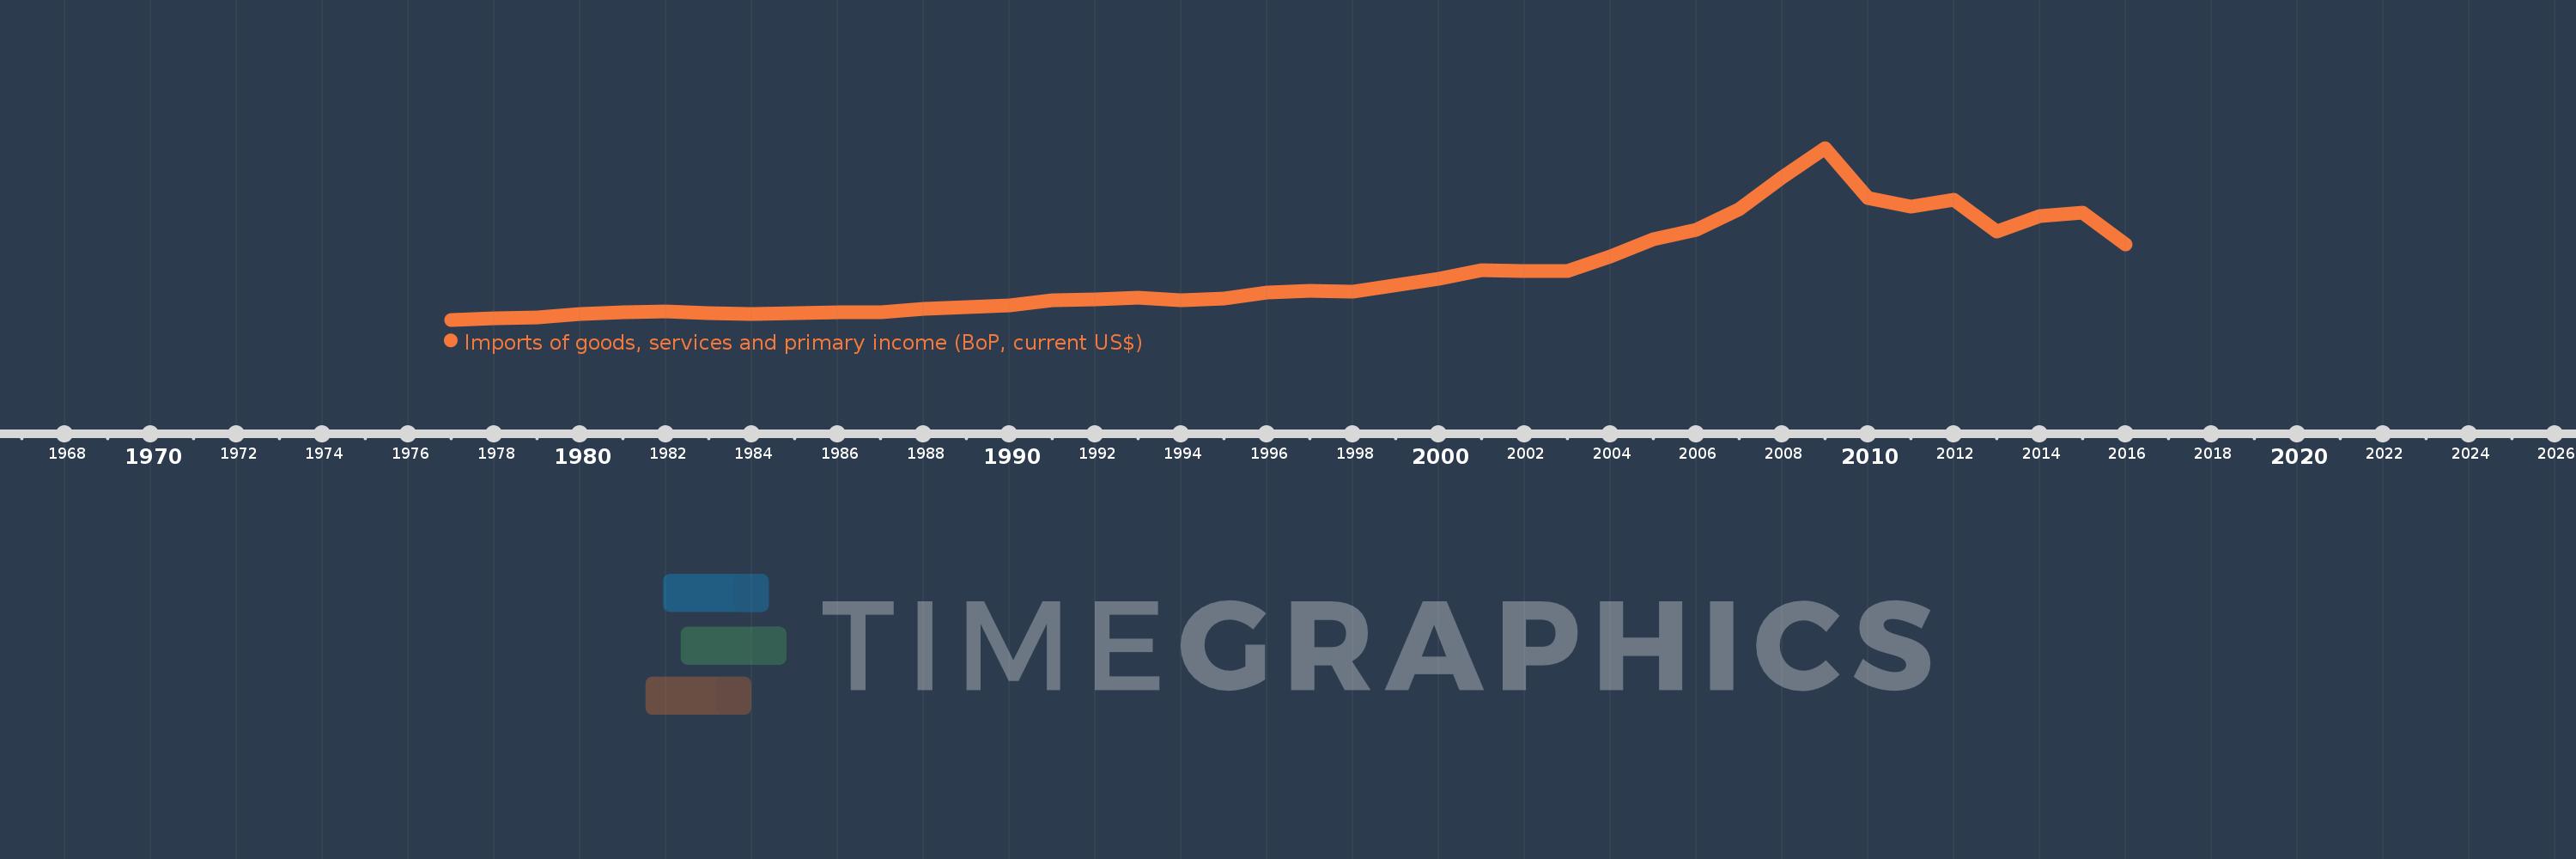
Imports of goods, services and primary income (BoP, current US$)
2016,2015,2014,2013,2012,2011,2010,2009,2008,2007,2006,2005,2004,2003,2002,2001,2000,1998,1997,1996,1995,1994,1993,1992,1991,1990,1989,1988,1987,1986,1985,1984,1983,1982,1981,1980,1979,1978,1977
This statistics in other country:
AfghanistanAlbaniaAlgeriaAngolaAntigua and BarbudaArab WorldArgentinaArmeniaArubaAustraliaAustriaAzerbaijanBahamas, TheBahrainBangladeshBarbadosBelarusBelgiumBelizeBeninBermudaBhutanBoliviaBosnia and HerzegovinaBotswanaBrazilBrunei DarussalamBulgariaBurkina FasoBurundiCabo VerdeCambodiaCameroonCanadaCaribbean small statesCentral African RepublicCentral Europe and the BalticsChadChileChinaColombiaComorosCongo, Dem. Rep.Congo, Rep.Costa RicaCote d'IvoireCroatiaCuracaoCyprusCzech RepublicDenmarkDjiboutiDominicaDominican RepublicEarly-demographic dividendEast Asia & PacificEast Asia & Pacific (excluding high income)East Asia & Pacific (IDA & IBRD countries)EcuadorEgypt, Arab Rep.El SalvadorEquatorial GuineaEritreaEstoniaEthiopiaEuro areaEurope & Central AsiaEurope & Central Asia (excluding high income)Europe & Central Asia (IDA & IBRD countries)European UnionFaroe IslandsFijiFinlandFragile and conflict affected situationsFranceFrench PolynesiaGabonGambia, TheGeorgiaGermanyGhanaGreeceGrenadaGuatemalaGuineaGuinea-BissauGuyanaHaitiHeavily indebted poor countries (HIPC)High incomeHondurasHong Kong SAR, ChinaHungaryIBRD onlyIcelandIDA & IBRD totalIDA blendIDA onlyIDA totalIndiaIndonesiaIran, Islamic Rep.IraqIrelandIsraelItalyJamaicaJapanJordanKazakhstanKenyaKiribatiKorea, Rep.KosovoKuwaitKyrgyz RepublicLao PDRLate-demographic dividendLatin America & Caribbean Latin America & Caribbean (excluding high income)Latin America & the Caribbean (IDA & IBRD countries)LatviaLeast developed countries: UN classificationLebanonLesothoLiberiaLibyaLithuaniaLow & middle incomeLow incomeLower middle incomeLuxembourgMacao SAR, ChinaMacedonia, FYRMadagascarMalawiMalaysiaMaldivesMaliMaltaMarshall IslandsMauritaniaMauritiusMexicoMicronesia, Fed. Sts.Middle East & North Africa (excluding high income)Middle East & North Africa (IDA & IBRD countries)Middle incomeMoldovaMongoliaMontenegroMoroccoMozambiqueMyanmarNamibiaNepalNetherlandsNew CaledoniaNicaraguaNigerNigeriaNorth AmericaNorwayOECD membersOmanOther small statesPacific island small statesPakistanPalauPanamaPapua New GuineaParaguayPeruPhilippinesPolandPortugalPost-demographic dividendPre-demographic dividendQatarRomaniaRussian FederationRwandaSamoaSao Tome and PrincipeSaudi ArabiaSenegalSerbiaSeychellesSierra LeoneSingaporeSint Maarten (Dutch part)Slovak RepublicSloveniaSmall statesSolomon IslandsSouth AfricaSouth AsiaSouth Asia (IDA & IBRD)South SudanSpainSri LankaSt. Kitts and NevisSt. LuciaSt. Vincent and the GrenadinesSub-Saharan Africa Sub-Saharan Africa (excluding high income)Sub-Saharan Africa (IDA & IBRD countries)SudanSurinameSwazilandSwedenSwitzerlandSyrian Arab RepublicTajikistanTanzaniaThailandTimor-LesteTogoTongaTrinidad and TobagoTunisiaTurkeyTuvaluUgandaUkraineUnited KingdomUnited StatesUpper middle incomeUruguayVanuatuVenezuela, RBVietnamWest Bank and GazaWorldYemen, Rep.ZambiaZimbabwe Timeline:
This timeline shows a graph from 1977 to 2016 of Greece. No data until 1976. Number of actual observations by date: 39.
Source name:
World Development Indicators
Source organization:
International Monetary Fund, Balance of Payments Statistics Yearbook and data files.
Categories, topics:
Economy & Growth, External Debt, Trade
Last updated:
apr 23, 2017
Indicators value changes by year
Minimum:
5.941 bln
jan 1, 1977
Maximum:
143.512 bln
jan 1, 2009
At the date of observation
Value
Absolute change
Change from previous value
jan 1, 1977
5.941 bln
+5.941 bln
0.0%
jan 1, 1978
6.832 bln
+891.0 mln
15.0%
jan 1, 1979
7.842 bln
+1.01 bln
14.78%
jan 1, 1980
10.731 bln
+2.889 bln
36.84%
jan 1, 1981
11.67 bln
+939.0 mln
8.75%
jan 1, 1982
12.828 bln
+1.158 bln
9.92%
jan 1, 1983
11.382 bln
-1.446 bln
-11.27%
jan 1, 1984
10.811 bln
-571.0 mln
-5.02%
jan 1, 1985
11.097 bln
+286.0 mln
2.65%
jan 1, 1986
12.053 bln
+956.0 mln
8.61%
jan 1, 1987
11.948 bln
-105.0 mln
-0.87%
jan 1, 1988
14.474 bln
+2.526 bln
21.14%
jan 1, 1989
15.985 bln
+1.511 bln
10.44%
jan 1, 1990
17.729 bln
+1.744 bln
10.91%
jan 1, 1991
21.588 bln
+3.859 bln
21.77%
jan 1, 1992
22.311 bln
+723.05 mln
3.35%
jan 1, 1993
23.943 bln
+1.632 bln
7.31%
jan 1, 1994
21.499 bln
-2.444 bln
-10.21%
jan 1, 1995
22.732 bln
+1.233 bln
5.74%
jan 1, 1996
27.707 bln
+4.975 bln
21.89%
jan 1, 1997
28.97 bln
+1.263 bln
4.56%
jan 1, 1998
28.441 bln
-529.0 mln
-1.83%
jan 1, 2000
38.939 bln
+10.498 bln
36.91%
jan 1, 2001
45.384 bln
+6.445 bln
16.55%
jan 1, 2002
44.912 bln
-472.07 mln
-1.04%
jan 1, 2003
44.6 bln
-311.572 mln
-0.69%
jan 1, 2004
56.827 bln
+12.227 bln
27.41%
jan 1, 2005
70.283 bln
+13.456 bln
23.68%
jan 1, 2006
77.719 bln
+7.436 bln
10.58%
jan 1, 2007
94.444 bln
+16.725 bln
21.52%
jan 1, 2008
120.094 bln
+25.65 bln
27.16%
jan 1, 2009
143.512 bln
+23.418 bln
19.5%
jan 1, 2010
103.082 bln
-40.43 bln
-28.17%
jan 1, 2011
96.203 bln
-6.879 bln
-6.67%
jan 1, 2012
102.077 bln
+5.874 bln
6.11%
jan 1, 2013
76.719 bln
-25.358 bln
-24.84%
jan 1, 2014
88.813 bln
+12.095 bln
15.76%
jan 1, 2015
91.465 bln
+2.652 bln
2.99%
jan 1, 2016
66.024 bln
-25.441 bln
-27.82%
Ranking of countries by current statistics by years


Comments: