29
/
en
AIzaSyAYiBZKx7MnpbEhh9jyipgxe19OcubqV5w
April 1, 2024
51942
North America
NAC
false
2
1
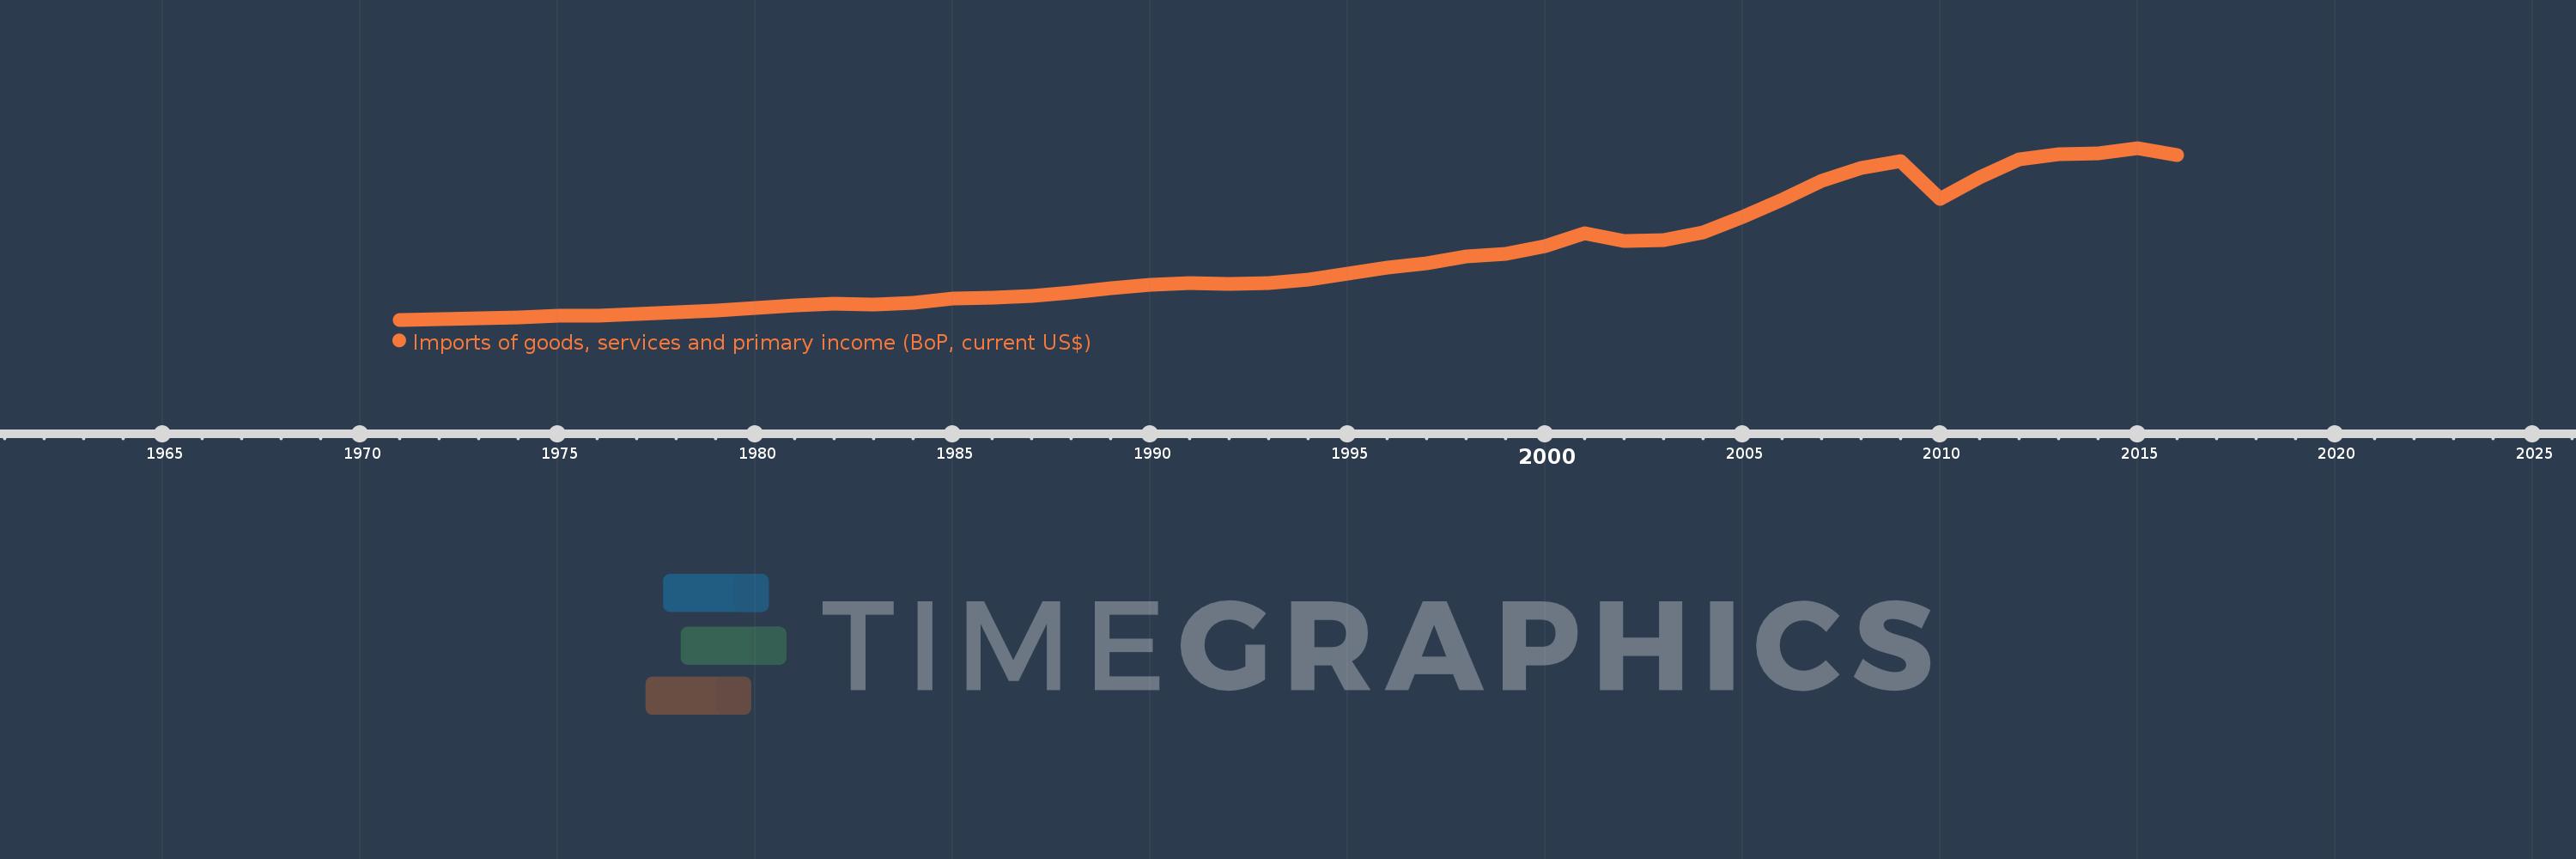
Imports of goods, services and primary income (BoP, current US$)
2016,2015,2014,2013,2012,2011,2010,2009,2008,2007,2006,2005,2004,2003,2002,2001,2000,1999,1998,1997,1996,1995,1994,1993,1992,1991,1990,1989,1988,1987,1986,1985,1984,1983,1982,1981,1980,1979,1978,1977,1976,1975,1974,1973,1972,1971
This statistics in other country:
AfghanistanAlbaniaAlgeriaAngolaAntigua and BarbudaArab WorldArgentinaArmeniaArubaAustraliaAustriaAzerbaijanBahamas, TheBahrainBangladeshBarbadosBelarusBelgiumBelizeBeninBermudaBhutanBoliviaBosnia and HerzegovinaBotswanaBrazilBrunei DarussalamBulgariaBurkina FasoBurundiCabo VerdeCambodiaCameroonCanadaCaribbean small statesCentral African RepublicCentral Europe and the BalticsChadChileChinaColombiaComorosCongo, Dem. Rep.Congo, Rep.Costa RicaCote d'IvoireCroatiaCuracaoCyprusCzech RepublicDenmarkDjiboutiDominicaDominican RepublicEarly-demographic dividendEast Asia & PacificEast Asia & Pacific (excluding high income)East Asia & Pacific (IDA & IBRD countries)EcuadorEgypt, Arab Rep.El SalvadorEquatorial GuineaEritreaEstoniaEthiopiaEuro areaEurope & Central AsiaEurope & Central Asia (excluding high income)Europe & Central Asia (IDA & IBRD countries)European UnionFaroe IslandsFijiFinlandFragile and conflict affected situationsFranceFrench PolynesiaGabonGambia, TheGeorgiaGermanyGhanaGreeceGrenadaGuatemalaGuineaGuinea-BissauGuyanaHaitiHeavily indebted poor countries (HIPC)High incomeHondurasHong Kong SAR, ChinaHungaryIBRD onlyIcelandIDA & IBRD totalIDA blendIDA onlyIDA totalIndiaIndonesiaIran, Islamic Rep.IraqIrelandIsraelItalyJamaicaJapanJordanKazakhstanKenyaKiribatiKorea, Rep.KosovoKuwaitKyrgyz RepublicLao PDRLate-demographic dividendLatin America & Caribbean Latin America & Caribbean (excluding high income)Latin America & the Caribbean (IDA & IBRD countries)LatviaLeast developed countries: UN classificationLebanonLesothoLiberiaLibyaLithuaniaLow & middle incomeLow incomeLower middle incomeLuxembourgMacao SAR, ChinaMacedonia, FYRMadagascarMalawiMalaysiaMaldivesMaliMaltaMarshall IslandsMauritaniaMauritiusMexicoMicronesia, Fed. Sts.Middle East & North Africa (excluding high income)Middle East & North Africa (IDA & IBRD countries)Middle incomeMoldovaMongoliaMontenegroMoroccoMozambiqueMyanmarNamibiaNepalNetherlandsNew CaledoniaNicaraguaNigerNigeriaNorth AmericaNorwayOECD membersOmanOther small statesPacific island small statesPakistanPalauPanamaPapua New GuineaParaguayPeruPhilippinesPolandPortugalPost-demographic dividendPre-demographic dividendQatarRomaniaRussian FederationRwandaSamoaSao Tome and PrincipeSaudi ArabiaSenegalSerbiaSeychellesSierra LeoneSingaporeSint Maarten (Dutch part)Slovak RepublicSloveniaSmall statesSolomon IslandsSouth AfricaSouth AsiaSouth Asia (IDA & IBRD)South SudanSpainSri LankaSt. Kitts and NevisSt. LuciaSt. Vincent and the GrenadinesSub-Saharan Africa Sub-Saharan Africa (excluding high income)Sub-Saharan Africa (IDA & IBRD countries)SudanSurinameSwazilandSwedenSwitzerlandSyrian Arab RepublicTajikistanTanzaniaThailandTimor-LesteTogoTongaTrinidad and TobagoTunisiaTurkeyTuvaluUgandaUkraineUnited KingdomUnited StatesUpper middle incomeUruguayVanuatuVenezuela, RBVietnamWest Bank and GazaWorldYemen, Rep.ZambiaZimbabwe Timeline:
This timeline shows a graph from 1971 to 2016 of North America. No data until 1970. Number of actual observations by date: 46.
Source name:
World Development Indicators
Source organization:
International Monetary Fund, Balance of Payments Statistics Yearbook and data files.
Categories, topics:
Economy & Growth, External Debt, Trade
Last updated:
apr 23, 2017
Indicators value changes by year
Minimum:
80.158 bln
jan 1, 1971
Maximum:
4.147 trl
jan 1, 2015
At the date of observation
Value
Absolute change
Change from previous value
jan 1, 1971
80.158 bln
+80.158 bln
0.0%
jan 1, 1972
89.497 bln
+9.339 bln
11.65%
jan 1, 1973
106.297 bln
+16.8 bln
18.77%
jan 1, 1974
133.042 bln
+26.745 bln
25.16%
jan 1, 1975
184.549 bln
+51.507 bln
38.72%
jan 1, 1976
182.679 bln
-1.869 bln
-1.01%
jan 1, 1977
218.041 bln
+35.362 bln
19.36%
jan 1, 1978
253.03 bln
+34.988 bln
16.05%
jan 1, 1979
295.658 bln
+42.629 bln
16.85%
jan 1, 1980
361.577 bln
+65.919 bln
22.3%
jan 1, 1981
423.007 bln
+61.431 bln
16.99%
jan 1, 1982
467.552 bln
+44.545 bln
10.53%
jan 1, 1983
444.898 bln
-22.654 bln
-4.85%
jan 1, 1984
473.574 bln
+28.676 bln
6.45%
jan 1, 1985
585.867 bln
+112.292 bln
23.71%
jan 1, 1986
600.289 bln
+14.423 bln
2.46%
jan 1, 1987
652.085 bln
+51.796 bln
8.63%
jan 1, 1988
729.192 bln
+77.108 bln
11.82%
jan 1, 1989
824.674 bln
+95.482 bln
13.09%
jan 1, 1990
898.812 bln
+74.137 bln
8.99%
jan 1, 1991
943.599 bln
+44.788 bln
4.98%
jan 1, 1992
918.728 bln
-24.871 bln
-2.64%
jan 1, 1993
953.641 bln
+34.913 bln
3.8%
jan 1, 1994
1.025 trl
+71.574 bln
7.51%
jan 1, 1995
1.17 trl
+144.993 bln
14.14%
jan 1, 1996
1.323 trl
+152.811 bln
13.06%
jan 1, 1997
1.411 trl
+87.939 bln
6.65%
jan 1, 1998
1.571 trl
+159.704 bln
11.32%
jan 1, 1999
1.642 trl
+71.488 bln
4.55%
jan 1, 2000
1.823 trl
+181.132 bln
11.03%
jan 1, 2001
2.124 trl
+300.781 bln
16.5%
jan 1, 2002
1.948 trl
-175.585 bln
-8.27%
jan 1, 2003
1.972 trl
+23.784 bln
1.22%
jan 1, 2004
2.139 trl
+167.074 bln
8.47%
jan 1, 2005
2.517 trl
+377.911 bln
17.66%
jan 1, 2006
2.927 trl
+409.538 bln
16.27%
jan 1, 2007
3.376 trl
+448.729 bln
15.33%
jan 1, 2008
3.666 trl
+290.631 bln
8.61%
jan 1, 2009
3.828 trl
+161.779 bln
4.41%
jan 1, 2010
2.939 trl
-889.078 bln
-23.23%
jan 1, 2011
3.442 trl
+503.646 bln
17.14%
jan 1, 2012
3.879 trl
+436.956 bln
12.69%
jan 1, 2013
3.997 trl
+117.083 bln
3.02%
jan 1, 2014
4.017 trl
+20.2 bln
0.51%
jan 1, 2015
4.147 trl
+130.511 bln
3.25%
jan 1, 2016
3.972 trl
-175.514 bln
-4.23%
Ranking of countries by current statistics by years


Comments: