29
/
en
AIzaSyAYiBZKx7MnpbEhh9jyipgxe19OcubqV5w
April 1, 2024
152652
Hungary
HUN
true
2
1
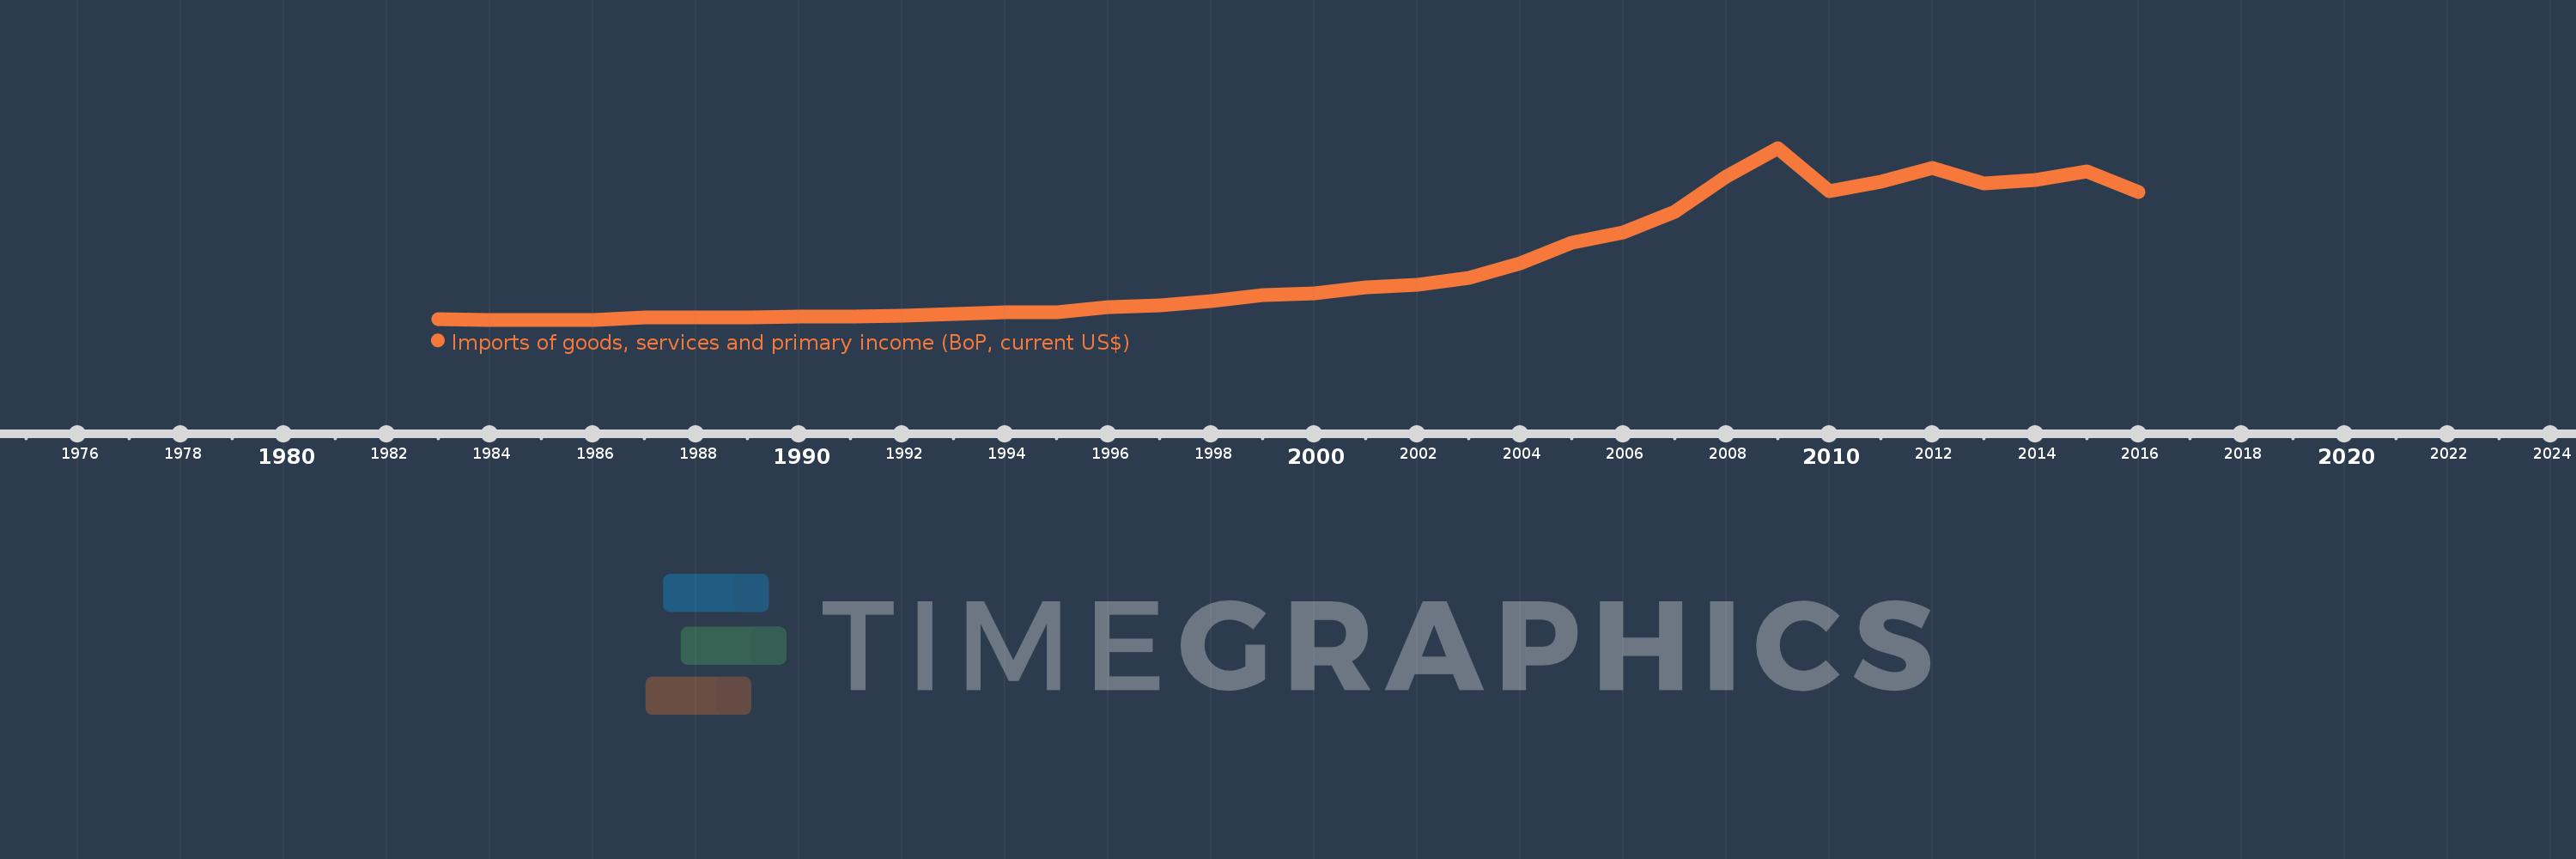
Imports of goods, services and primary income (BoP, current US$)
2016,2015,2014,2013,2012,2011,2010,2009,2008,2007,2006,2005,2004,2003,2002,2001,2000,1999,1998,1997,1996,1995,1994,1993,1992,1991,1990,1989,1988,1987,1986,1985,1984,1983
This statistics in other country:
AfghanistanAlbaniaAlgeriaAngolaAntigua and BarbudaArab WorldArgentinaArmeniaArubaAustraliaAustriaAzerbaijanBahamas, TheBahrainBangladeshBarbadosBelarusBelgiumBelizeBeninBermudaBhutanBoliviaBosnia and HerzegovinaBotswanaBrazilBrunei DarussalamBulgariaBurkina FasoBurundiCabo VerdeCambodiaCameroonCanadaCaribbean small statesCentral African RepublicCentral Europe and the BalticsChadChileChinaColombiaComorosCongo, Dem. Rep.Congo, Rep.Costa RicaCote d'IvoireCroatiaCuracaoCyprusCzech RepublicDenmarkDjiboutiDominicaDominican RepublicEarly-demographic dividendEast Asia & PacificEast Asia & Pacific (excluding high income)East Asia & Pacific (IDA & IBRD countries)EcuadorEgypt, Arab Rep.El SalvadorEquatorial GuineaEritreaEstoniaEthiopiaEuro areaEurope & Central AsiaEurope & Central Asia (excluding high income)Europe & Central Asia (IDA & IBRD countries)European UnionFaroe IslandsFijiFinlandFragile and conflict affected situationsFranceFrench PolynesiaGabonGambia, TheGeorgiaGermanyGhanaGreeceGrenadaGuatemalaGuineaGuinea-BissauGuyanaHaitiHeavily indebted poor countries (HIPC)High incomeHondurasHong Kong SAR, ChinaHungaryIBRD onlyIcelandIDA & IBRD totalIDA blendIDA onlyIDA totalIndiaIndonesiaIran, Islamic Rep.IraqIrelandIsraelItalyJamaicaJapanJordanKazakhstanKenyaKiribatiKorea, Rep.KosovoKuwaitKyrgyz RepublicLao PDRLate-demographic dividendLatin America & Caribbean Latin America & Caribbean (excluding high income)Latin America & the Caribbean (IDA & IBRD countries)LatviaLeast developed countries: UN classificationLebanonLesothoLiberiaLibyaLithuaniaLow & middle incomeLow incomeLower middle incomeLuxembourgMacao SAR, ChinaMacedonia, FYRMadagascarMalawiMalaysiaMaldivesMaliMaltaMarshall IslandsMauritaniaMauritiusMexicoMicronesia, Fed. Sts.Middle East & North Africa (excluding high income)Middle East & North Africa (IDA & IBRD countries)Middle incomeMoldovaMongoliaMontenegroMoroccoMozambiqueMyanmarNamibiaNepalNetherlandsNew CaledoniaNicaraguaNigerNigeriaNorth AmericaNorwayOECD membersOmanOther small statesPacific island small statesPakistanPalauPanamaPapua New GuineaParaguayPeruPhilippinesPolandPortugalPost-demographic dividendPre-demographic dividendQatarRomaniaRussian FederationRwandaSamoaSao Tome and PrincipeSaudi ArabiaSenegalSerbiaSeychellesSierra LeoneSingaporeSint Maarten (Dutch part)Slovak RepublicSloveniaSmall statesSolomon IslandsSouth AfricaSouth AsiaSouth Asia (IDA & IBRD)South SudanSpainSri LankaSt. Kitts and NevisSt. LuciaSt. Vincent and the GrenadinesSub-Saharan Africa Sub-Saharan Africa (excluding high income)Sub-Saharan Africa (IDA & IBRD countries)SudanSurinameSwazilandSwedenSwitzerlandSyrian Arab RepublicTajikistanTanzaniaThailandTimor-LesteTogoTongaTrinidad and TobagoTunisiaTurkeyTuvaluUgandaUkraineUnited KingdomUnited StatesUpper middle incomeUruguayVanuatuVenezuela, RBVietnamWest Bank and GazaWorldYemen, Rep.ZambiaZimbabwe Timeline:
This timeline shows a graph from 1983 to 2016 of Hungary. No data until 1982. Number of actual observations by date: 34.
Source name:
World Development Indicators
Source organization:
International Monetary Fund, Balance of Payments Statistics Yearbook and data files.
Categories, topics:
Economy & Growth, External Debt, Trade
Last updated:
apr 23, 2017
Indicators value changes by year
Minimum:
9.851 bln
jan 1, 1985
Maximum:
153.54 bln
jan 1, 2009
At the date of observation
Value
Absolute change
Change from previous value
jan 1, 1983
10.374 bln
+10.374 bln
0.0%
jan 1, 1984
9.921 bln
-453.135 mln
-4.37%
jan 1, 1985
9.851 bln
-69.982 mln
-0.71%
jan 1, 1986
9.915 bln
+63.92 mln
0.65%
jan 1, 1987
11.628 bln
+1.713 bln
17.28%
jan 1, 1988
11.975 bln
+347.128 mln
2.99%
jan 1, 1989
11.965 bln
-10.142 mln
-0.08%
jan 1, 1990
12.733 bln
+767.994 mln
6.42%
jan 1, 1991
12.724 bln
-9.072 mln
-0.07%
jan 1, 1992
12.999 bln
+274.935 mln
2.16%
jan 1, 1993
14.432 bln
+1.433 bln
11.03%
jan 1, 1994
16.415 bln
+1.982 bln
13.73%
jan 1, 1995
16.404 bln
-10.677 mln
-0.07%
jan 1, 1996
20.202 bln
+3.798 bln
23.15%
jan 1, 1997
21.935 bln
+1.733 bln
8.58%
jan 1, 1998
25.667 bln
+3.732 bln
17.01%
jan 1, 1999
30.214 bln
+4.546 bln
17.71%
jan 1, 2000
32.221 bln
+2.007 bln
6.64%
jan 1, 2001
36.615 bln
+4.395 bln
13.64%
jan 1, 2002
39.288 bln
+2.672 bln
7.3%
jan 1, 2003
44.91 bln
+5.623 bln
14.31%
jan 1, 2004
57.044 bln
+12.134 bln
27.02%
jan 1, 2005
74.559 bln
+17.515 bln
30.7%
jan 1, 2006
82.611 bln
+8.052 bln
10.8%
jan 1, 2007
100.149 bln
+17.538 bln
21.23%
jan 1, 2008
129.276 bln
+29.127 bln
29.08%
jan 1, 2009
153.54 bln
+24.264 bln
18.77%
jan 1, 2010
117.359 bln
-36.181 bln
-23.56%
jan 1, 2011
125.505 bln
+8.146 bln
6.94%
jan 1, 2012
136.572 bln
+11.067 bln
8.82%
jan 1, 2013
123.56 bln
-13.012 bln
-9.53%
jan 1, 2014
126.613 bln
+3.053 bln
2.47%
jan 1, 2015
133.97 bln
+7.357 bln
5.81%
jan 1, 2016
116.725 bln
-17.245 bln
-12.87%
Ranking of countries by current statistics by years


Comments: