29
/
en
AIzaSyAYiBZKx7MnpbEhh9jyipgxe19OcubqV5w
April 1, 2024
24188
Arab World
ARB
false
2
1
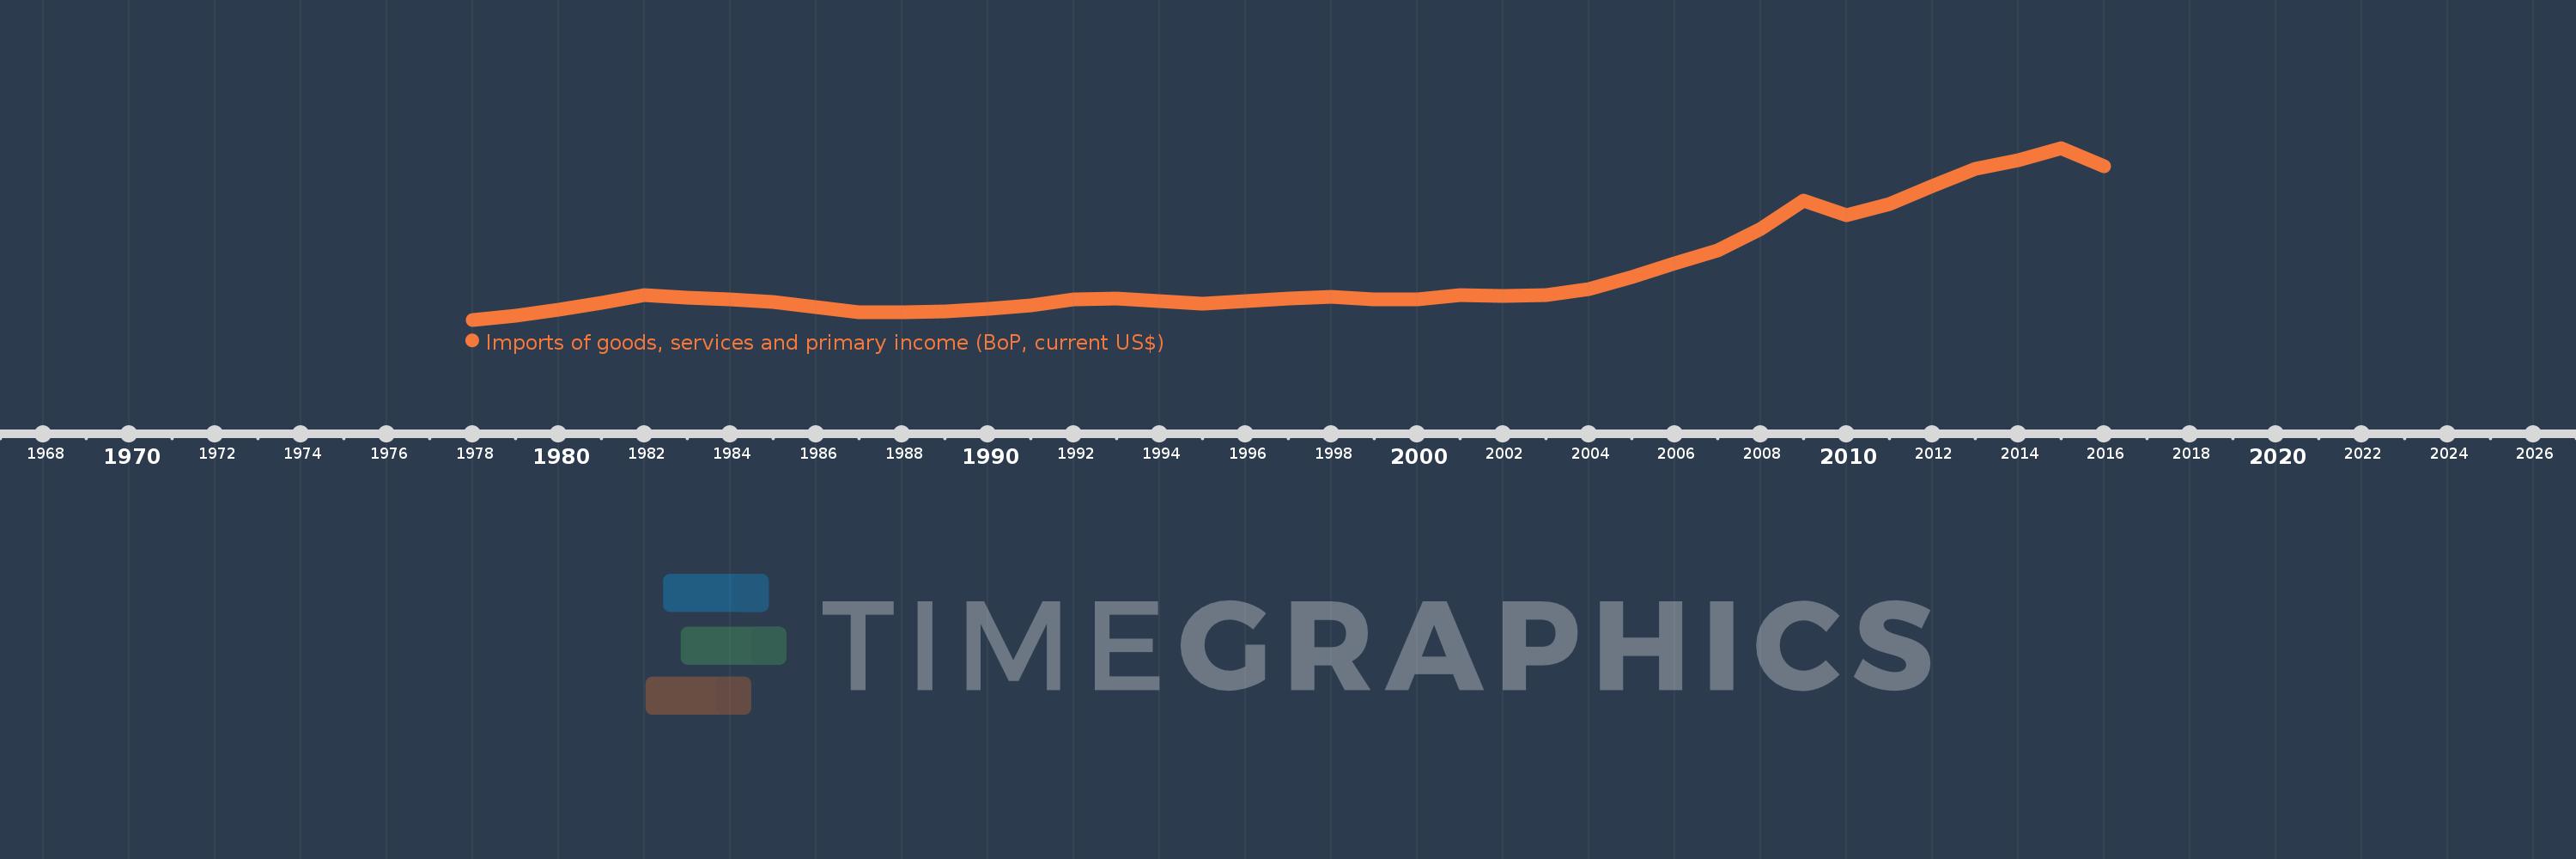
Imports of goods, services and primary income (BoP, current US$)
2016,2015,2014,2013,2012,2011,2010,2009,2008,2007,2006,2005,2004,2003,2002,2001,2000,1999,1998,1997,1996,1995,1994,1993,1992,1991,1990,1989,1988,1987,1986,1985,1984,1983,1982,1981,1980,1979,1978
This statistics in other country:
AfghanistanAlbaniaAlgeriaAngolaAntigua and BarbudaArab WorldArgentinaArmeniaArubaAustraliaAustriaAzerbaijanBahamas, TheBahrainBangladeshBarbadosBelarusBelgiumBelizeBeninBermudaBhutanBoliviaBosnia and HerzegovinaBotswanaBrazilBrunei DarussalamBulgariaBurkina FasoBurundiCabo VerdeCambodiaCameroonCanadaCaribbean small statesCentral African RepublicCentral Europe and the BalticsChadChileChinaColombiaComorosCongo, Dem. Rep.Congo, Rep.Costa RicaCote d'IvoireCroatiaCuracaoCyprusCzech RepublicDenmarkDjiboutiDominicaDominican RepublicEarly-demographic dividendEast Asia & PacificEast Asia & Pacific (excluding high income)East Asia & Pacific (IDA & IBRD countries)EcuadorEgypt, Arab Rep.El SalvadorEquatorial GuineaEritreaEstoniaEthiopiaEuro areaEurope & Central AsiaEurope & Central Asia (excluding high income)Europe & Central Asia (IDA & IBRD countries)European UnionFaroe IslandsFijiFinlandFragile and conflict affected situationsFranceFrench PolynesiaGabonGambia, TheGeorgiaGermanyGhanaGreeceGrenadaGuatemalaGuineaGuinea-BissauGuyanaHaitiHeavily indebted poor countries (HIPC)High incomeHondurasHong Kong SAR, ChinaHungaryIBRD onlyIcelandIDA & IBRD totalIDA blendIDA onlyIDA totalIndiaIndonesiaIran, Islamic Rep.IraqIrelandIsraelItalyJamaicaJapanJordanKazakhstanKenyaKiribatiKorea, Rep.KosovoKuwaitKyrgyz RepublicLao PDRLate-demographic dividendLatin America & Caribbean Latin America & Caribbean (excluding high income)Latin America & the Caribbean (IDA & IBRD countries)LatviaLeast developed countries: UN classificationLebanonLesothoLiberiaLibyaLithuaniaLow & middle incomeLow incomeLower middle incomeLuxembourgMacao SAR, ChinaMacedonia, FYRMadagascarMalawiMalaysiaMaldivesMaliMaltaMarshall IslandsMauritaniaMauritiusMexicoMicronesia, Fed. Sts.Middle East & North Africa (excluding high income)Middle East & North Africa (IDA & IBRD countries)Middle incomeMoldovaMongoliaMontenegroMoroccoMozambiqueMyanmarNamibiaNepalNetherlandsNew CaledoniaNicaraguaNigerNigeriaNorth AmericaNorwayOECD membersOmanOther small statesPacific island small statesPakistanPalauPanamaPapua New GuineaParaguayPeruPhilippinesPolandPortugalPost-demographic dividendPre-demographic dividendQatarRomaniaRussian FederationRwandaSamoaSao Tome and PrincipeSaudi ArabiaSenegalSerbiaSeychellesSierra LeoneSingaporeSint Maarten (Dutch part)Slovak RepublicSloveniaSmall statesSolomon IslandsSouth AfricaSouth AsiaSouth Asia (IDA & IBRD)South SudanSpainSri LankaSt. Kitts and NevisSt. LuciaSt. Vincent and the GrenadinesSub-Saharan Africa Sub-Saharan Africa (excluding high income)Sub-Saharan Africa (IDA & IBRD countries)SudanSurinameSwazilandSwedenSwitzerlandSyrian Arab RepublicTajikistanTanzaniaThailandTimor-LesteTogoTongaTrinidad and TobagoTunisiaTurkeyTuvaluUgandaUkraineUnited KingdomUnited StatesUpper middle incomeUruguayVanuatuVenezuela, RBVietnamWest Bank and GazaWorldYemen, Rep.ZambiaZimbabwe Timeline:
This timeline shows a graph from 1978 to 2016 of Arab World. No data until 1977. Number of actual observations by date: 39.
Source name:
World Development Indicators
Source organization:
International Monetary Fund, Balance of Payments Statistics Yearbook and data files.
Categories, topics:
Economy & Growth, External Debt, Trade
Last updated:
apr 23, 2017
Indicators value changes by year
Minimum:
132.341 bln
jan 1, 1978
Maximum:
1.298 trl
jan 1, 2015
At the date of observation
Value
Absolute change
Change from previous value
jan 1, 1978
132.341 bln
+132.341 bln
0.0%
jan 1, 1979
157.71 bln
+25.37 bln
19.17%
jan 1, 1980
198.742 bln
+41.032 bln
26.02%
jan 1, 1981
246.802 bln
+48.06 bln
24.18%
jan 1, 1982
297.719 bln
+50.917 bln
20.63%
jan 1, 1983
281.845 bln
-15.874 bln
-5.33%
jan 1, 1984
269.052 bln
-12.793 bln
-4.54%
jan 1, 1985
254.995 bln
-14.057 bln
-5.22%
jan 1, 1986
216.086 bln
-38.909 bln
-15.26%
jan 1, 1987
181.101 bln
-34.985 bln
-16.19%
jan 1, 1988
181.765 bln
+663.7 mln
0.37%
jan 1, 1989
188.006 bln
+6.241 bln
3.43%
jan 1, 1990
203.957 bln
+15.951 bln
8.48%
jan 1, 1991
230.582 bln
+26.625 bln
13.05%
jan 1, 1992
273.342 bln
+42.76 bln
18.54%
jan 1, 1993
277.587 bln
+4.245 bln
1.55%
jan 1, 1994
256.98 bln
-20.607 bln
-7.42%
jan 1, 1995
239.604 bln
-17.377 bln
-6.76%
jan 1, 1996
258.979 bln
+19.375 bln
8.09%
jan 1, 1997
276.527 bln
+17.548 bln
6.78%
jan 1, 1998
286.179 bln
+9.652 bln
3.49%
jan 1, 1999
272.925 bln
-13.255 bln
-4.63%
jan 1, 2000
270.532 bln
-2.392 bln
-0.88%
jan 1, 2001
298.331 bln
+27.799 bln
10.28%
jan 1, 2002
291.462 bln
-6.869 bln
-2.3%
jan 1, 2003
301.454 bln
+9.992 bln
3.43%
jan 1, 2004
339.225 bln
+37.771 bln
12.53%
jan 1, 2005
419.392 bln
+80.166 bln
23.63%
jan 1, 2006
515.083 bln
+95.691 bln
22.82%
jan 1, 2007
604.197 bln
+89.114 bln
17.3%
jan 1, 2008
745.938 bln
+141.741 bln
23.46%
jan 1, 2009
939.606 bln
+193.668 bln
25.96%
jan 1, 2010
842.474 bln
-97.132 bln
-10.34%
jan 1, 2011
915.198 bln
+72.724 bln
8.63%
jan 1, 2012
1.041 trl
+125.71 bln
13.74%
jan 1, 2013
1.155 trl
+114.265 bln
10.98%
jan 1, 2014
1.215 trl
+59.427 bln
5.14%
jan 1, 2015
1.298 trl
+83.141 bln
6.85%
jan 1, 2016
1.176 trl
-121.372 bln
-9.35%
Ranking of countries by current statistics by years


Comments: