29
/
en
AIzaSyAYiBZKx7MnpbEhh9jyipgxe19OcubqV5w
April 1, 2024
123624
Ecuador
ECU
true
2
1
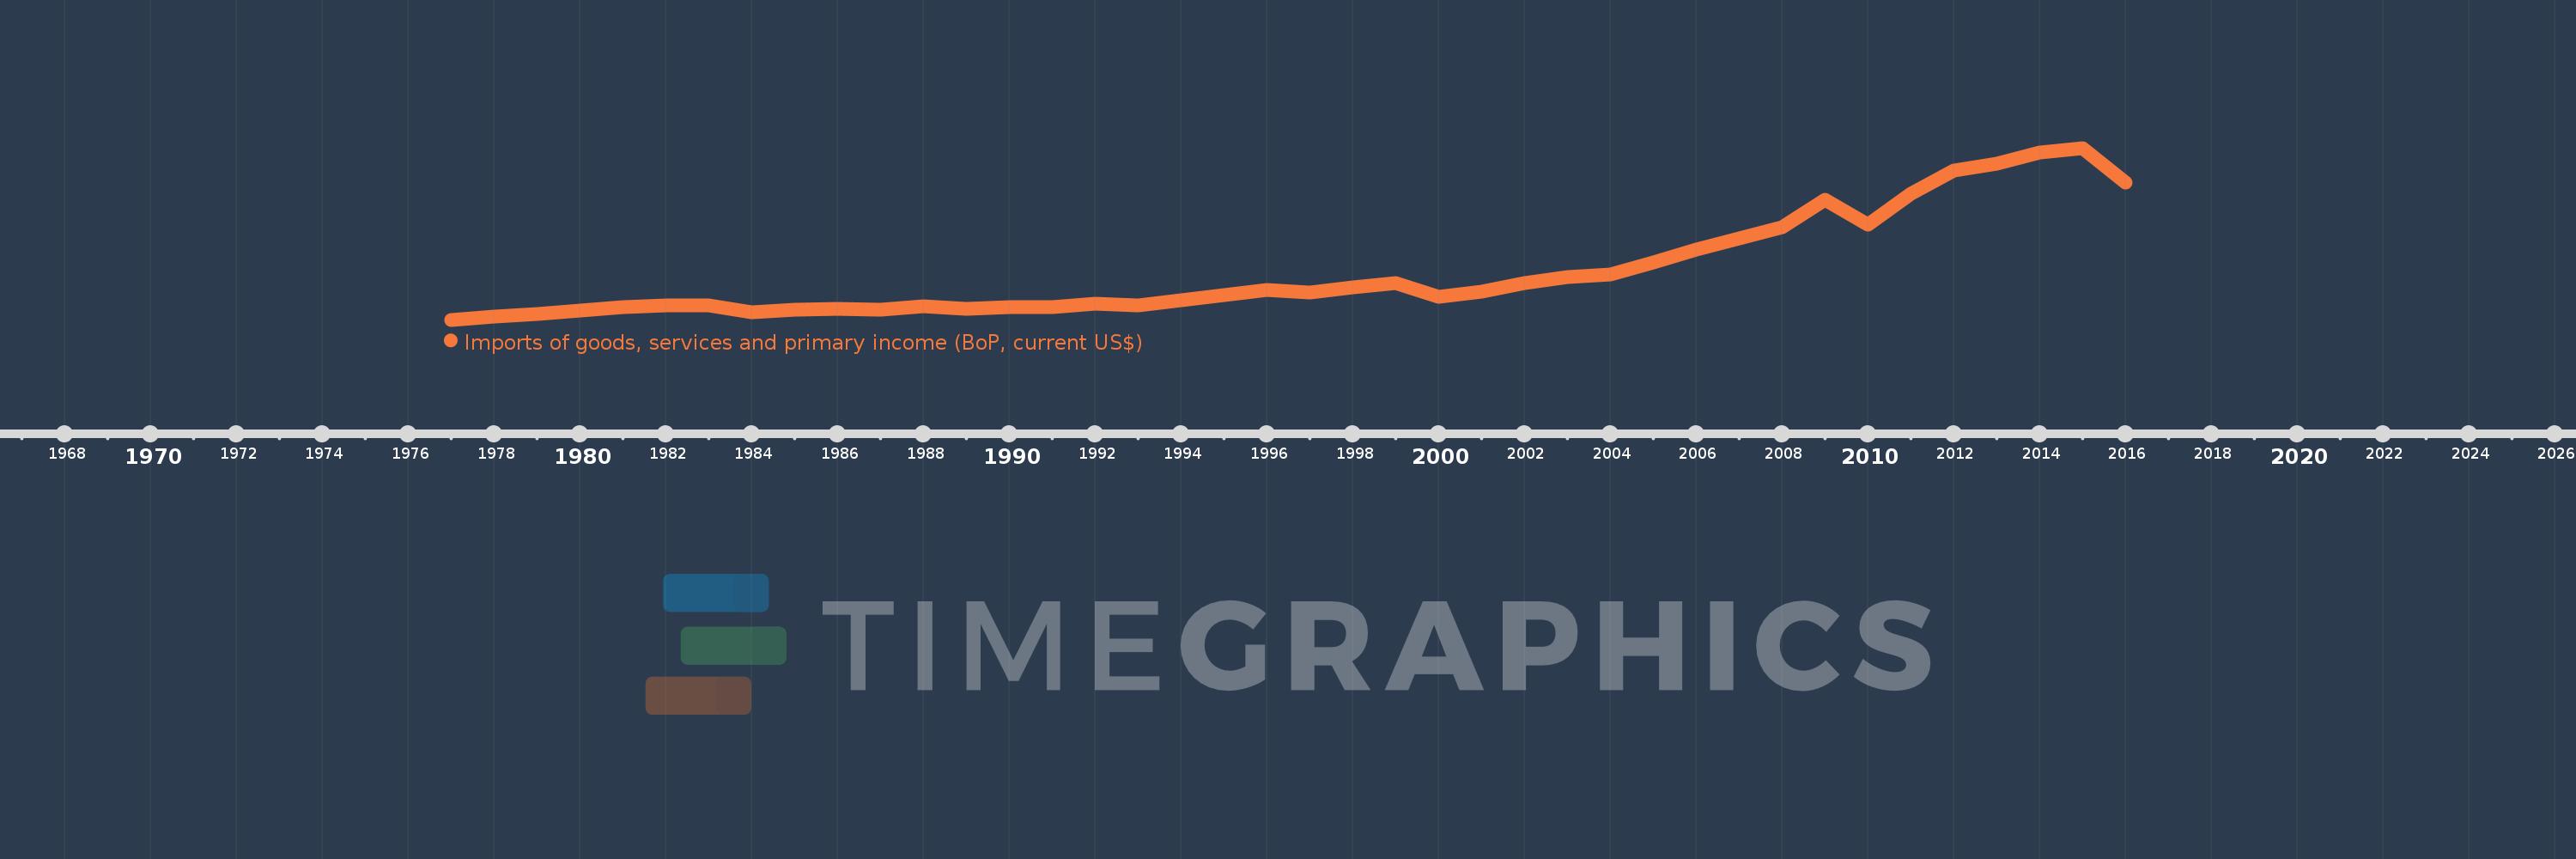
Imports of goods, services and primary income (BoP, current US$)
2016,2015,2014,2013,2012,2011,2010,2009,2008,2007,2006,2005,2004,2003,2002,2001,2000,1999,1998,1997,1996,1995,1994,1993,1992,1991,1990,1989,1988,1987,1986,1985,1984,1983,1982,1981,1980,1979,1978,1977
This statistics in other country:
AfghanistanAlbaniaAlgeriaAngolaAntigua and BarbudaArab WorldArgentinaArmeniaArubaAustraliaAustriaAzerbaijanBahamas, TheBahrainBangladeshBarbadosBelarusBelgiumBelizeBeninBermudaBhutanBoliviaBosnia and HerzegovinaBotswanaBrazilBrunei DarussalamBulgariaBurkina FasoBurundiCabo VerdeCambodiaCameroonCanadaCaribbean small statesCentral African RepublicCentral Europe and the BalticsChadChileChinaColombiaComorosCongo, Dem. Rep.Congo, Rep.Costa RicaCote d'IvoireCroatiaCuracaoCyprusCzech RepublicDenmarkDjiboutiDominicaDominican RepublicEarly-demographic dividendEast Asia & PacificEast Asia & Pacific (excluding high income)East Asia & Pacific (IDA & IBRD countries)EcuadorEgypt, Arab Rep.El SalvadorEquatorial GuineaEritreaEstoniaEthiopiaEuro areaEurope & Central AsiaEurope & Central Asia (excluding high income)Europe & Central Asia (IDA & IBRD countries)European UnionFaroe IslandsFijiFinlandFragile and conflict affected situationsFranceFrench PolynesiaGabonGambia, TheGeorgiaGermanyGhanaGreeceGrenadaGuatemalaGuineaGuinea-BissauGuyanaHaitiHeavily indebted poor countries (HIPC)High incomeHondurasHong Kong SAR, ChinaHungaryIBRD onlyIcelandIDA & IBRD totalIDA blendIDA onlyIDA totalIndiaIndonesiaIran, Islamic Rep.IraqIrelandIsraelItalyJamaicaJapanJordanKazakhstanKenyaKiribatiKorea, Rep.KosovoKuwaitKyrgyz RepublicLao PDRLate-demographic dividendLatin America & Caribbean Latin America & Caribbean (excluding high income)Latin America & the Caribbean (IDA & IBRD countries)LatviaLeast developed countries: UN classificationLebanonLesothoLiberiaLibyaLithuaniaLow & middle incomeLow incomeLower middle incomeLuxembourgMacao SAR, ChinaMacedonia, FYRMadagascarMalawiMalaysiaMaldivesMaliMaltaMarshall IslandsMauritaniaMauritiusMexicoMicronesia, Fed. Sts.Middle East & North Africa (excluding high income)Middle East & North Africa (IDA & IBRD countries)Middle incomeMoldovaMongoliaMontenegroMoroccoMozambiqueMyanmarNamibiaNepalNetherlandsNew CaledoniaNicaraguaNigerNigeriaNorth AmericaNorwayOECD membersOmanOther small statesPacific island small statesPakistanPalauPanamaPapua New GuineaParaguayPeruPhilippinesPolandPortugalPost-demographic dividendPre-demographic dividendQatarRomaniaRussian FederationRwandaSamoaSao Tome and PrincipeSaudi ArabiaSenegalSerbiaSeychellesSierra LeoneSingaporeSint Maarten (Dutch part)Slovak RepublicSloveniaSmall statesSolomon IslandsSouth AfricaSouth AsiaSouth Asia (IDA & IBRD)South SudanSpainSri LankaSt. Kitts and NevisSt. LuciaSt. Vincent and the GrenadinesSub-Saharan Africa Sub-Saharan Africa (excluding high income)Sub-Saharan Africa (IDA & IBRD countries)SudanSurinameSwazilandSwedenSwitzerlandSyrian Arab RepublicTajikistanTanzaniaThailandTimor-LesteTogoTongaTrinidad and TobagoTunisiaTurkeyTuvaluUgandaUkraineUnited KingdomUnited StatesUpper middle incomeUruguayVanuatuVenezuela, RBVietnamWest Bank and GazaWorldYemen, Rep.ZambiaZimbabwe Timeline:
This timeline shows a graph from 1977 to 2016 of Ecuador. No data until 1976. Number of actual observations by date: 40.
Source name:
World Development Indicators
Source organization:
International Monetary Fund, Balance of Payments Statistics Yearbook and data files.
Categories, topics:
Economy & Growth, External Debt, Trade
Last updated:
apr 23, 2017
Indicators value changes by year
Minimum:
1.469 bln
jan 1, 1977
Maximum:
31.894 bln
jan 1, 2015
At the date of observation
Value
Absolute change
Change from previous value
jan 1, 1977
1.469 bln
+1.469 bln
0.0%
jan 1, 1978
2.006 bln
+536.7 mln
36.53%
jan 1, 1979
2.483 bln
+476.8 mln
23.77%
jan 1, 1980
3.133 bln
+650.4 mln
26.2%
jan 1, 1981
3.647 bln
+513.8 mln
16.4%
jan 1, 1982
4.018 bln
+371.2 mln
10.18%
jan 1, 1983
3.936 bln
-82.0 mln
-2.04%
jan 1, 1984
2.825 bln
-1.111 bln
-28.23%
jan 1, 1985
3.264 bln
+439.0 mln
15.54%
jan 1, 1986
3.335 bln
+71.0 mln
2.18%
jan 1, 1987
3.3 bln
-35.0 mln
-1.05%
jan 1, 1988
3.789 bln
+489.0 mln
14.82%
jan 1, 1989
3.439 bln
-350.0 mln
-9.24%
jan 1, 1990
3.702 bln
+263.0 mln
7.65%
jan 1, 1991
3.754 bln
+52.0 mln
1.4%
jan 1, 1992
4.256 bln
+502.0 mln
13.37%
jan 1, 1993
3.995 bln
-261.0 mln
-6.13%
jan 1, 1994
4.908 bln
+912.68 mln
22.85%
jan 1, 1995
5.894 bln
+986.01 mln
20.09%
jan 1, 1996
6.736 bln
+842.78 mln
14.3%
jan 1, 1997
6.239 bln
-497.15 mln
-7.38%
jan 1, 1998
7.253 bln
+1.013 bln
16.24%
jan 1, 1999
7.989 bln
+736.69 mln
10.16%
jan 1, 2000
5.592 bln
-2.398 bln
-30.01%
jan 1, 2001
6.403 bln
+811.031 mln
14.5%
jan 1, 2002
8.024 bln
+1.621 bln
25.32%
jan 1, 2003
9.095 bln
+1.071 bln
13.35%
jan 1, 2004
9.546 bln
+450.773 mln
4.96%
jan 1, 2005
11.591 bln
+2.046 bln
21.43%
jan 1, 2006
13.88 bln
+2.289 bln
19.74%
jan 1, 2007
15.863 bln
+1.983 bln
14.29%
jan 1, 2008
17.924 bln
+2.061 bln
12.99%
jan 1, 2009
22.692 bln
+4.768 bln
26.6%
jan 1, 2010
18.362 bln
-4.33 bln
-19.08%
jan 1, 2011
23.754 bln
+5.392 bln
29.36%
jan 1, 2012
27.88 bln
+4.126 bln
17.37%
jan 1, 2013
29.115 bln
+1.235 bln
4.43%
jan 1, 2014
31.069 bln
+1.953 bln
6.71%
jan 1, 2015
31.894 bln
+825.51 mln
2.66%
jan 1, 2016
25.814 bln
-6.08 bln
-19.06%
Ranking of countries by current statistics by years


Comments: