29
/
en
AIzaSyAYiBZKx7MnpbEhh9jyipgxe19OcubqV5w
April 1, 2024
187918
Malaysia
MYS
true
2
1
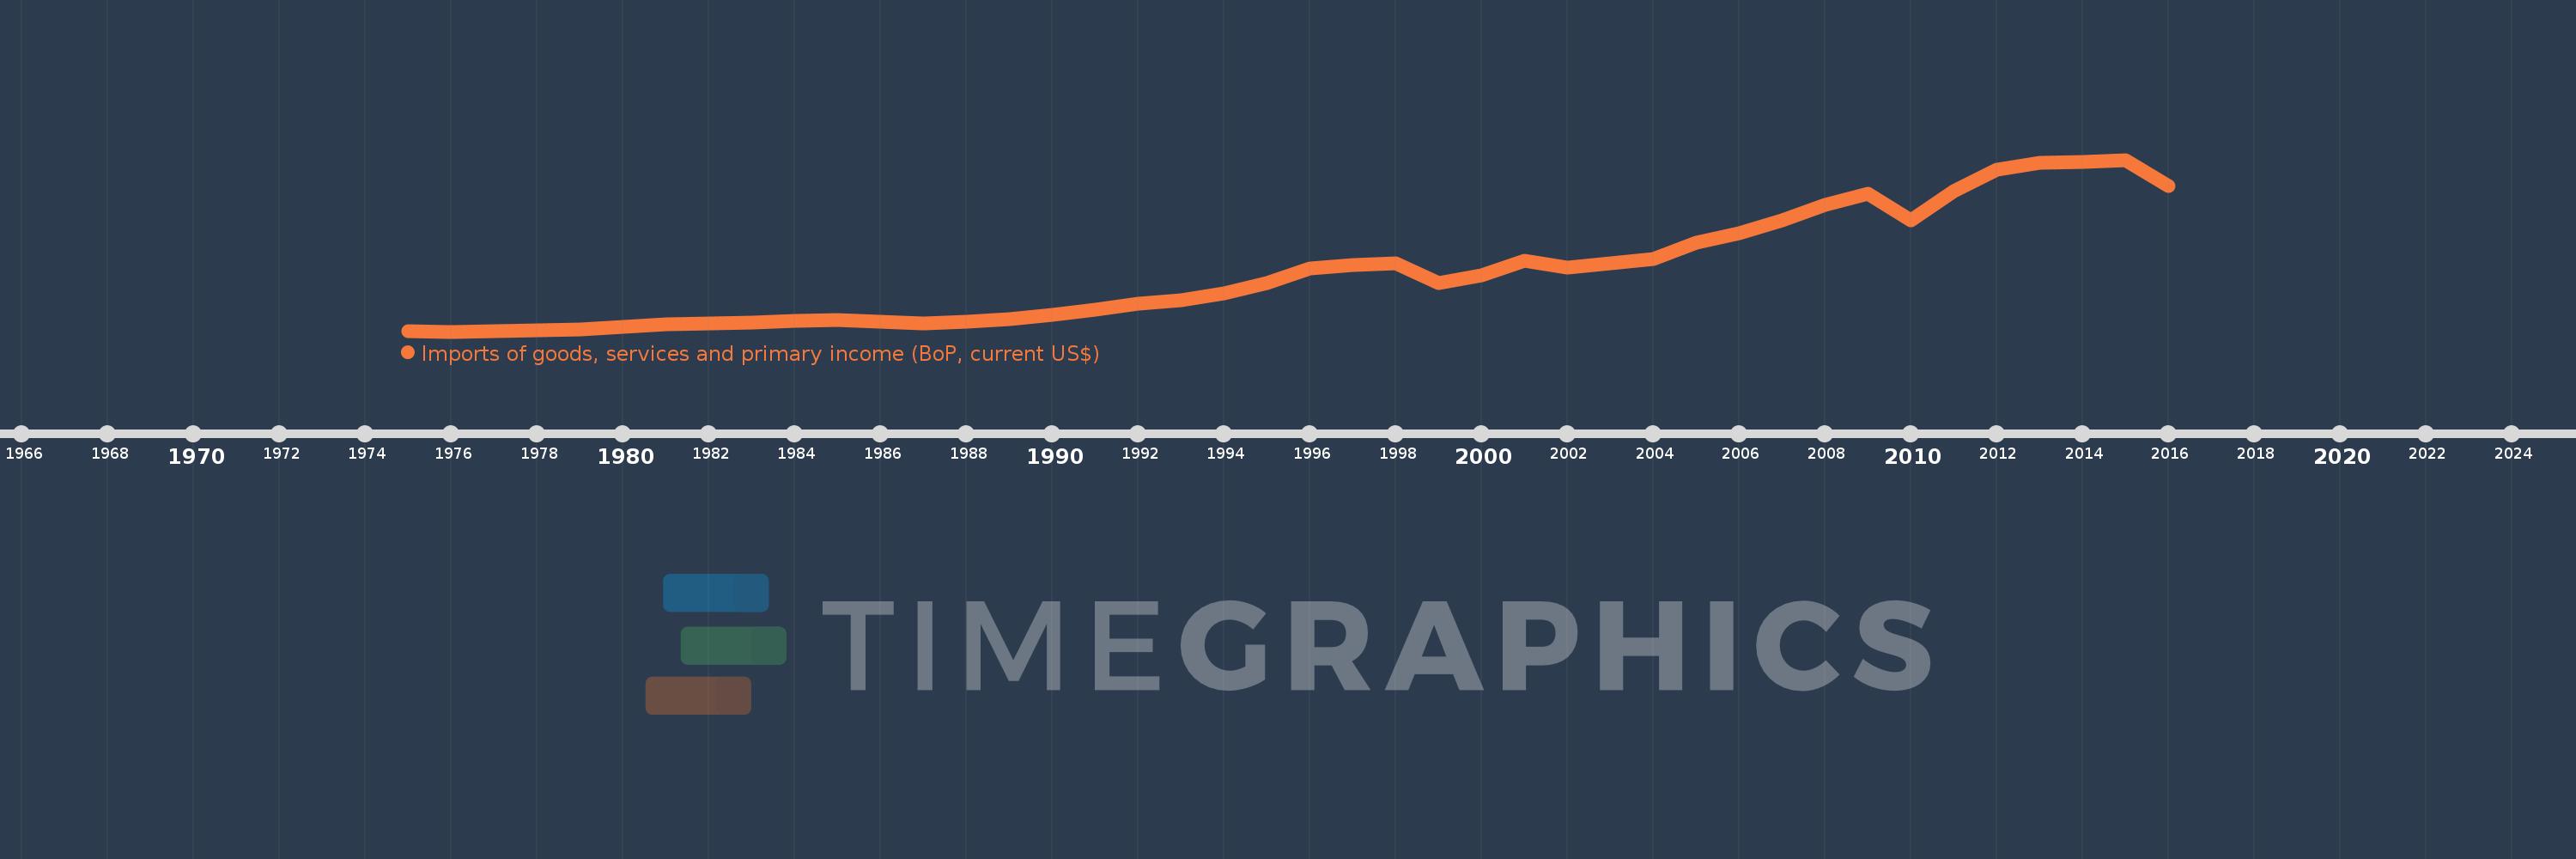
Imports of goods, services and primary income (BoP, current US$)
2016,2015,2014,2013,2012,2011,2010,2009,2008,2007,2006,2005,2004,2003,2002,2001,2000,1999,1998,1997,1996,1995,1994,1993,1992,1991,1990,1989,1988,1987,1986,1985,1984,1983,1982,1981,1980,1979,1978,1977,1976,1975
This statistics in other country:
AfghanistanAlbaniaAlgeriaAngolaAntigua and BarbudaArab WorldArgentinaArmeniaArubaAustraliaAustriaAzerbaijanBahamas, TheBahrainBangladeshBarbadosBelarusBelgiumBelizeBeninBermudaBhutanBoliviaBosnia and HerzegovinaBotswanaBrazilBrunei DarussalamBulgariaBurkina FasoBurundiCabo VerdeCambodiaCameroonCanadaCaribbean small statesCentral African RepublicCentral Europe and the BalticsChadChileChinaColombiaComorosCongo, Dem. Rep.Congo, Rep.Costa RicaCote d'IvoireCroatiaCuracaoCyprusCzech RepublicDenmarkDjiboutiDominicaDominican RepublicEarly-demographic dividendEast Asia & PacificEast Asia & Pacific (excluding high income)East Asia & Pacific (IDA & IBRD countries)EcuadorEgypt, Arab Rep.El SalvadorEquatorial GuineaEritreaEstoniaEthiopiaEuro areaEurope & Central AsiaEurope & Central Asia (excluding high income)Europe & Central Asia (IDA & IBRD countries)European UnionFaroe IslandsFijiFinlandFragile and conflict affected situationsFranceFrench PolynesiaGabonGambia, TheGeorgiaGermanyGhanaGreeceGrenadaGuatemalaGuineaGuinea-BissauGuyanaHaitiHeavily indebted poor countries (HIPC)High incomeHondurasHong Kong SAR, ChinaHungaryIBRD onlyIcelandIDA & IBRD totalIDA blendIDA onlyIDA totalIndiaIndonesiaIran, Islamic Rep.IraqIrelandIsraelItalyJamaicaJapanJordanKazakhstanKenyaKiribatiKorea, Rep.KosovoKuwaitKyrgyz RepublicLao PDRLate-demographic dividendLatin America & Caribbean Latin America & Caribbean (excluding high income)Latin America & the Caribbean (IDA & IBRD countries)LatviaLeast developed countries: UN classificationLebanonLesothoLiberiaLibyaLithuaniaLow & middle incomeLow incomeLower middle incomeLuxembourgMacao SAR, ChinaMacedonia, FYRMadagascarMalawiMalaysiaMaldivesMaliMaltaMarshall IslandsMauritaniaMauritiusMexicoMicronesia, Fed. Sts.Middle East & North Africa (excluding high income)Middle East & North Africa (IDA & IBRD countries)Middle incomeMoldovaMongoliaMontenegroMoroccoMozambiqueMyanmarNamibiaNepalNetherlandsNew CaledoniaNicaraguaNigerNigeriaNorth AmericaNorwayOECD membersOmanOther small statesPacific island small statesPakistanPalauPanamaPapua New GuineaParaguayPeruPhilippinesPolandPortugalPost-demographic dividendPre-demographic dividendQatarRomaniaRussian FederationRwandaSamoaSao Tome and PrincipeSaudi ArabiaSenegalSerbiaSeychellesSierra LeoneSingaporeSint Maarten (Dutch part)Slovak RepublicSloveniaSmall statesSolomon IslandsSouth AfricaSouth AsiaSouth Asia (IDA & IBRD)South SudanSpainSri LankaSt. Kitts and NevisSt. LuciaSt. Vincent and the GrenadinesSub-Saharan Africa Sub-Saharan Africa (excluding high income)Sub-Saharan Africa (IDA & IBRD countries)SudanSurinameSwazilandSwedenSwitzerlandSyrian Arab RepublicTajikistanTanzaniaThailandTimor-LesteTogoTongaTrinidad and TobagoTunisiaTurkeyTuvaluUgandaUkraineUnited KingdomUnited StatesUpper middle incomeUruguayVanuatuVenezuela, RBVietnamWest Bank and GazaWorldYemen, Rep.ZambiaZimbabwe Timeline:
This timeline shows a graph from 1975 to 2016 of Malaysia. No data until 1974. Number of actual observations by date: 42.
Source name:
World Development Indicators
Source organization:
International Monetary Fund, Balance of Payments Statistics Yearbook and data files.
Categories, topics:
Economy & Growth, External Debt, Trade
Last updated:
apr 23, 2017
Indicators value changes by year
Minimum:
4.855 bln
jan 1, 1976
Maximum:
245.415 bln
jan 1, 2015
At the date of observation
Value
Absolute change
Change from previous value
jan 1, 1975
5.233 bln
+5.233 bln
0.0%
jan 1, 1976
4.855 bln
-377.849 mln
-7.22%
jan 1, 1977
5.246 bln
+391.277 mln
8.06%
jan 1, 1978
6.373 bln
+1.127 bln
21.48%
jan 1, 1979
8.233 bln
+1.86 bln
29.19%
jan 1, 1980
11.482 bln
+3.248 bln
39.45%
jan 1, 1981
15.1 bln
+3.619 bln
31.52%
jan 1, 1982
16.331 bln
+1.23 bln
8.15%
jan 1, 1983
17.867 bln
+1.537 bln
9.41%
jan 1, 1984
19.705 bln
+1.838 bln
10.29%
jan 1, 1985
20.7 bln
+994.506 mln
5.05%
jan 1, 1986
18.383 bln
-2.317 bln
-11.19%
jan 1, 1987
16.345 bln
-2.038 bln
-11.09%
jan 1, 1988
18.485 bln
+2.14 bln
13.1%
jan 1, 1989
22.79 bln
+4.305 bln
23.29%
jan 1, 1990
28.641 bln
+5.851 bln
25.67%
jan 1, 1991
35.486 bln
+6.845 bln
23.9%
jan 1, 1992
43.783 bln
+8.297 bln
23.38%
jan 1, 1993
48.76 bln
+4.977 bln
11.37%
jan 1, 1994
57.935 bln
+9.175 bln
18.82%
jan 1, 1995
73.275 bln
+15.34 bln
26.48%
jan 1, 1996
93.618 bln
+20.343 bln
27.76%
jan 1, 1997
98.093 bln
+4.475 bln
4.78%
jan 1, 1998
100.176 bln
+2.083 bln
2.12%
jan 1, 1999
72.95 bln
-27.226 bln
-27.18%
jan 1, 2000
83.639 bln
+10.688 bln
14.65%
jan 1, 2001
103.86 bln
+20.221 bln
24.18%
jan 1, 2002
94.771 bln
-9.089 bln
-8.75%
jan 1, 2003
100.403 bln
+5.632 bln
5.94%
jan 1, 2004
106.189 bln
+5.786 bln
5.76%
jan 1, 2005
129.237 bln
+23.047 bln
21.7%
jan 1, 2006
142.268 bln
+13.031 bln
10.08%
jan 1, 2007
160.3 bln
+18.032 bln
12.67%
jan 1, 2008
182.563 bln
+22.263 bln
13.89%
jan 1, 2009
197.879 bln
+15.316 bln
8.39%
jan 1, 2010
160.181 bln
-37.698 bln
-19.05%
jan 1, 2011
201.594 bln
+41.413 bln
25.85%
jan 1, 2012
231.775 bln
+30.181 bln
14.97%
jan 1, 2013
240.783 bln
+9.008 bln
3.89%
jan 1, 2014
242.715 bln
+1.933 bln
0.8%
jan 1, 2015
245.415 bln
+2.699 bln
1.11%
jan 1, 2016
208.412 bln
-37.003 bln
-15.08%
Ranking of countries by current statistics by years


Comments: