29
/
en
AIzaSyAYiBZKx7MnpbEhh9jyipgxe19OcubqV5w
April 1, 2024
58183
South Asia (IDA & IBRD)
TSA
false
2
1
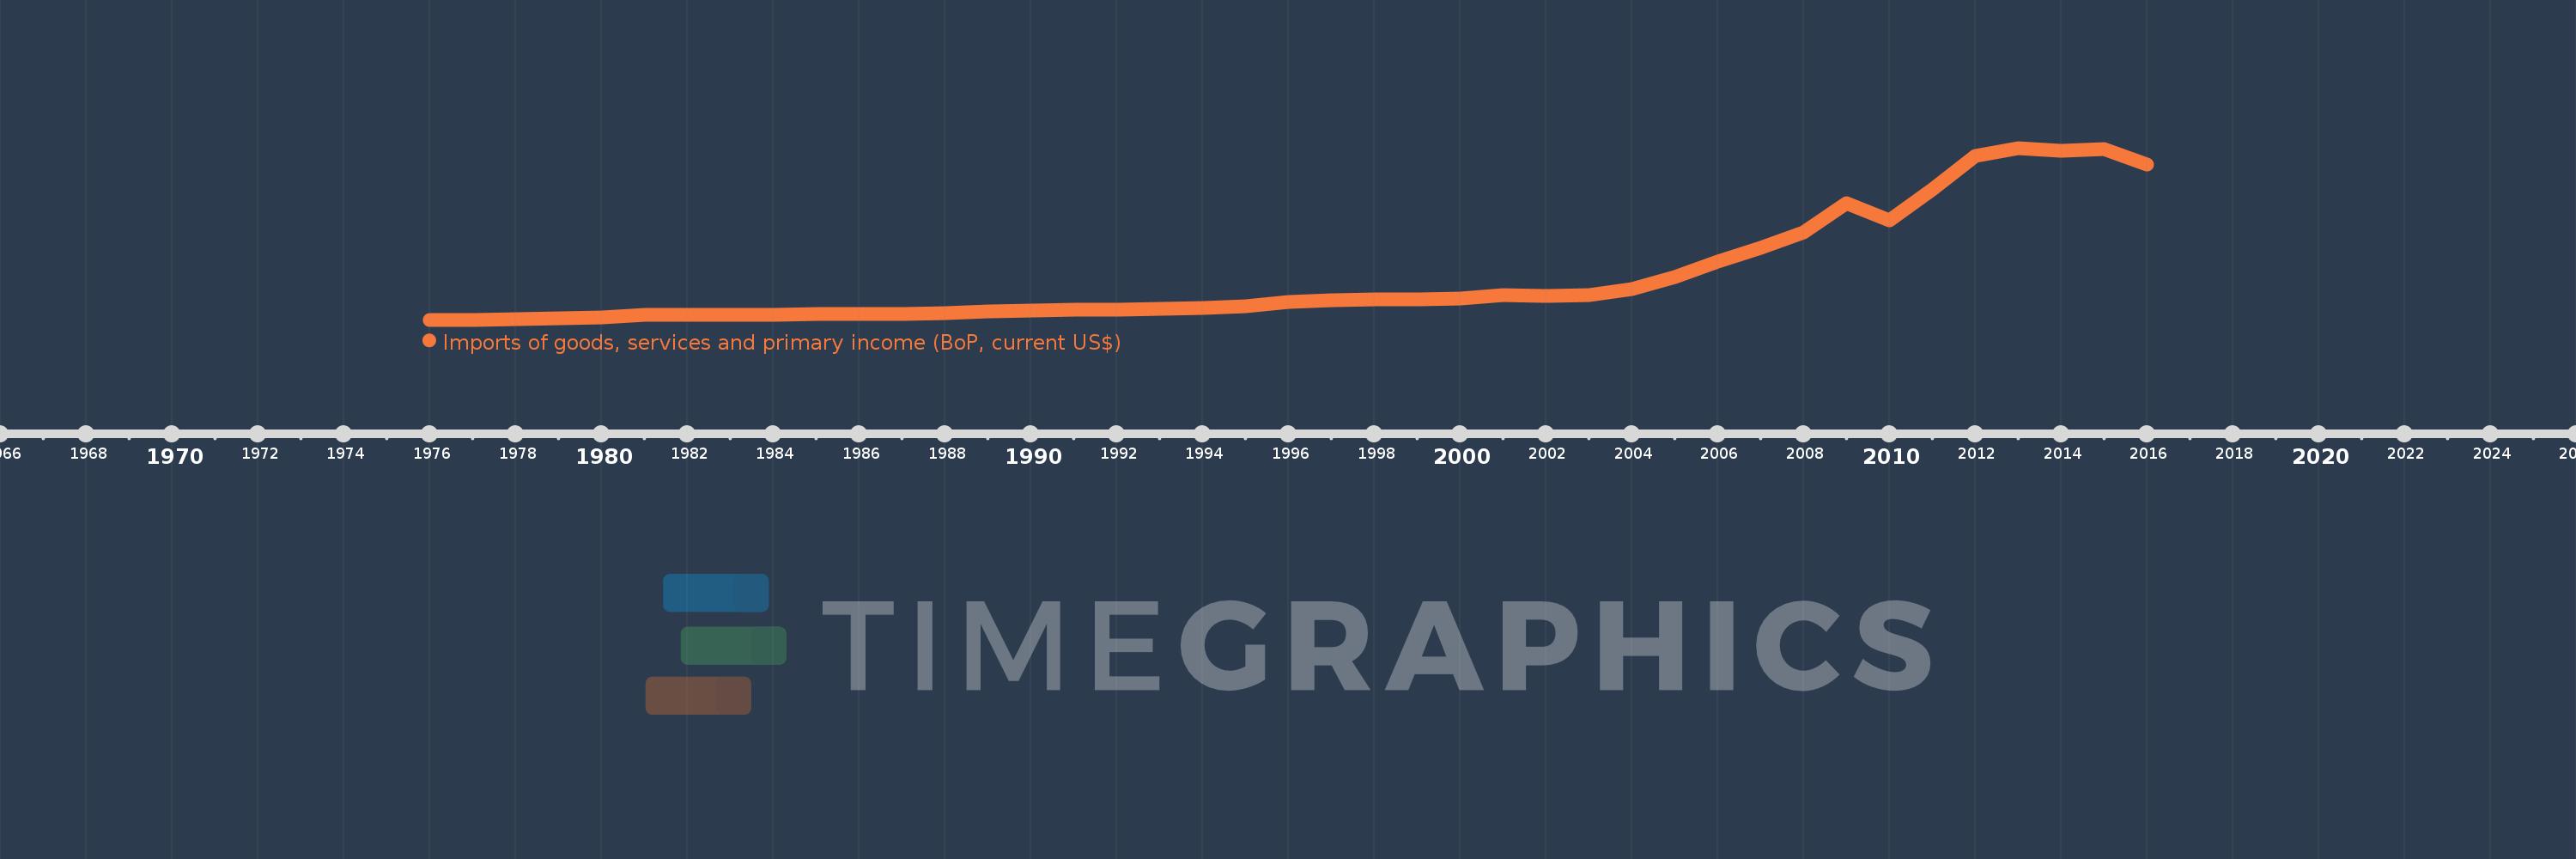
Imports of goods, services and primary income (BoP, current US$)
2016,2015,2014,2013,2012,2011,2010,2009,2008,2007,2006,2005,2004,2003,2002,2001,2000,1999,1998,1997,1996,1995,1994,1993,1992,1991,1990,1989,1988,1987,1986,1985,1984,1983,1982,1981,1980,1979,1978,1977,1976
This statistics in other country:
AfghanistanAlbaniaAlgeriaAngolaAntigua and BarbudaArab WorldArgentinaArmeniaArubaAustraliaAustriaAzerbaijanBahamas, TheBahrainBangladeshBarbadosBelarusBelgiumBelizeBeninBermudaBhutanBoliviaBosnia and HerzegovinaBotswanaBrazilBrunei DarussalamBulgariaBurkina FasoBurundiCabo VerdeCambodiaCameroonCanadaCaribbean small statesCentral African RepublicCentral Europe and the BalticsChadChileChinaColombiaComorosCongo, Dem. Rep.Congo, Rep.Costa RicaCote d'IvoireCroatiaCuracaoCyprusCzech RepublicDenmarkDjiboutiDominicaDominican RepublicEarly-demographic dividendEast Asia & PacificEast Asia & Pacific (excluding high income)East Asia & Pacific (IDA & IBRD countries)EcuadorEgypt, Arab Rep.El SalvadorEquatorial GuineaEritreaEstoniaEthiopiaEuro areaEurope & Central AsiaEurope & Central Asia (excluding high income)Europe & Central Asia (IDA & IBRD countries)European UnionFaroe IslandsFijiFinlandFragile and conflict affected situationsFranceFrench PolynesiaGabonGambia, TheGeorgiaGermanyGhanaGreeceGrenadaGuatemalaGuineaGuinea-BissauGuyanaHaitiHeavily indebted poor countries (HIPC)High incomeHondurasHong Kong SAR, ChinaHungaryIBRD onlyIcelandIDA & IBRD totalIDA blendIDA onlyIDA totalIndiaIndonesiaIran, Islamic Rep.IraqIrelandIsraelItalyJamaicaJapanJordanKazakhstanKenyaKiribatiKorea, Rep.KosovoKuwaitKyrgyz RepublicLao PDRLate-demographic dividendLatin America & Caribbean Latin America & Caribbean (excluding high income)Latin America & the Caribbean (IDA & IBRD countries)LatviaLeast developed countries: UN classificationLebanonLesothoLiberiaLibyaLithuaniaLow & middle incomeLow incomeLower middle incomeLuxembourgMacao SAR, ChinaMacedonia, FYRMadagascarMalawiMalaysiaMaldivesMaliMaltaMarshall IslandsMauritaniaMauritiusMexicoMicronesia, Fed. Sts.Middle East & North Africa (excluding high income)Middle East & North Africa (IDA & IBRD countries)Middle incomeMoldovaMongoliaMontenegroMoroccoMozambiqueMyanmarNamibiaNepalNetherlandsNew CaledoniaNicaraguaNigerNigeriaNorth AmericaNorwayOECD membersOmanOther small statesPacific island small statesPakistanPalauPanamaPapua New GuineaParaguayPeruPhilippinesPolandPortugalPost-demographic dividendPre-demographic dividendQatarRomaniaRussian FederationRwandaSamoaSao Tome and PrincipeSaudi ArabiaSenegalSerbiaSeychellesSierra LeoneSingaporeSint Maarten (Dutch part)Slovak RepublicSloveniaSmall statesSolomon IslandsSouth AfricaSouth AsiaSouth Asia (IDA & IBRD)South SudanSpainSri LankaSt. Kitts and NevisSt. LuciaSt. Vincent and the GrenadinesSub-Saharan Africa Sub-Saharan Africa (excluding high income)Sub-Saharan Africa (IDA & IBRD countries)SudanSurinameSwazilandSwedenSwitzerlandSyrian Arab RepublicTajikistanTanzaniaThailandTimor-LesteTogoTongaTrinidad and TobagoTunisiaTurkeyTuvaluUgandaUkraineUnited KingdomUnited StatesUpper middle incomeUruguayVanuatuVenezuela, RBVietnamWest Bank and GazaWorldYemen, Rep.ZambiaZimbabwe Timeline:
This timeline shows a graph from 1976 to 2016 of South Asia (IDA & IBRD). No data until 1975. Number of actual observations by date: 41.
Source name:
World Development Indicators
Source organization:
International Monetary Fund, Balance of Payments Statistics Yearbook and data files.
Categories, topics:
Economy & Growth, External Debt, Trade
Last updated:
apr 23, 2017
Indicators value changes by year
Minimum:
11.246 bln
jan 1, 1977
Maximum:
747.482 bln
jan 1, 2013
At the date of observation
Value
Absolute change
Change from previous value
jan 1, 1976
11.902 bln
+11.902 bln
0.0%
jan 1, 1977
11.246 bln
-655.657 mln
-5.51%
jan 1, 1978
13.003 bln
+1.757 bln
15.63%
jan 1, 1979
17.24 bln
+4.237 bln
32.58%
jan 1, 1980
22.775 bln
+5.535 bln
32.11%
jan 1, 1981
30.775 bln
+7.999 bln
35.12%
jan 1, 1982
31.717 bln
+942.068 mln
3.06%
jan 1, 1983
32.196 bln
+478.92 mln
1.51%
jan 1, 1984
32.25 bln
+54.215 mln
0.17%
jan 1, 1985
34.32 bln
+2.07 bln
6.42%
jan 1, 1986
35.298 bln
+978.74 mln
2.85%
jan 1, 1987
36.639 bln
+1.34 bln
3.8%
jan 1, 1988
39.946 bln
+3.308 bln
9.03%
jan 1, 1989
45.329 bln
+5.383 bln
13.47%
jan 1, 1990
49.548 bln
+4.219 bln
9.31%
jan 1, 1991
53.81 bln
+4.261 bln
8.6%
jan 1, 1992
53.233 bln
-576.664 mln
-1.07%
jan 1, 1993
58.35 bln
+5.117 bln
9.61%
jan 1, 1994
60.059 bln
+1.709 bln
2.93%
jan 1, 1995
70.01 bln
+9.951 bln
16.57%
jan 1, 1996
87.207 bln
+17.198 bln
24.56%
jan 1, 1997
95.163 bln
+7.956 bln
9.12%
jan 1, 1998
97.822 bln
+2.658 bln
2.79%
jan 1, 1999
97.69 bln
-131.774 mln
-0.13%
jan 1, 2000
102.158 bln
+4.468 bln
4.57%
jan 1, 2001
117.524 bln
+15.366 bln
15.04%
jan 1, 2002
114.636 bln
-2.887 bln
-2.46%
jan 1, 2003
118.7 bln
+4.064 bln
3.54%
jan 1, 2004
143.169 bln
+24.469 bln
20.61%
jan 1, 2005
193.3 bln
+50.131 bln
35.02%
jan 1, 2006
260.683 bln
+67.384 bln
34.86%
jan 1, 2007
317.706 bln
+57.023 bln
21.87%
jan 1, 2008
386.51 bln
+68.803 bln
21.66%
jan 1, 2009
511.875 bln
+125.365 bln
32.44%
jan 1, 2010
437.53 bln
-74.346 bln
-14.52%
jan 1, 2011
570.925 bln
+133.395 bln
30.49%
jan 1, 2012
711.799 bln
+140.874 bln
24.67%
jan 1, 2013
747.482 bln
+35.683 bln
5.01%
jan 1, 2014
735.992 bln
-11.49 bln
-1.54%
jan 1, 2015
742.106 bln
+6.114 bln
0.83%
jan 1, 2016
676.922 bln
-65.184 bln
-8.78%
Ranking of countries by current statistics by years


Comments: