29
/
en
AIzaSyAYiBZKx7MnpbEhh9jyipgxe19OcubqV5w
April 1, 2024
218471
Panama
PAN
true
2
1
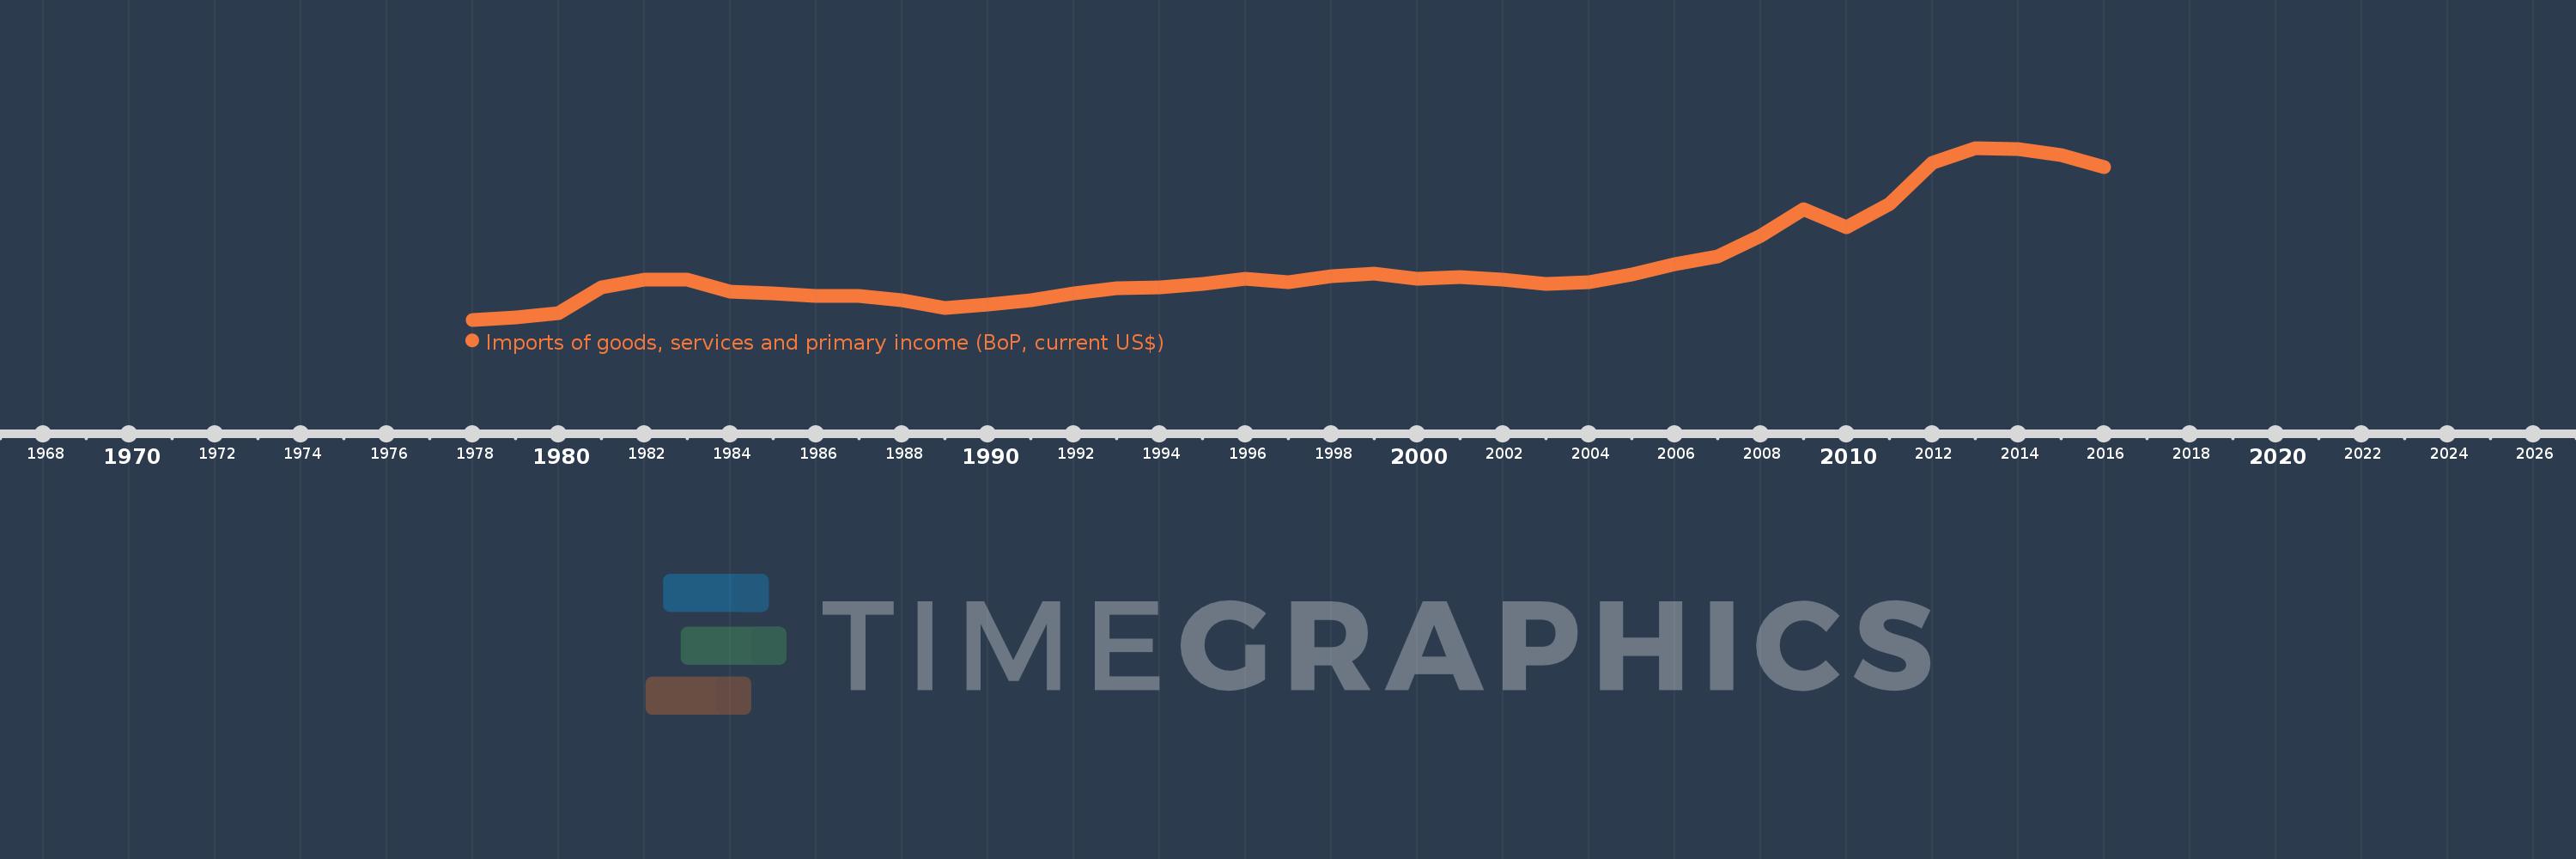
Imports of goods, services and primary income (BoP, current US$)
2016,2015,2014,2013,2012,2011,2010,2009,2008,2007,2006,2005,2004,2003,2002,2001,2000,1999,1998,1997,1996,1995,1994,1993,1992,1991,1990,1989,1988,1987,1986,1985,1984,1983,1982,1981,1980,1979,1978
This statistics in other country:
AfghanistanAlbaniaAlgeriaAngolaAntigua and BarbudaArab WorldArgentinaArmeniaArubaAustraliaAustriaAzerbaijanBahamas, TheBahrainBangladeshBarbadosBelarusBelgiumBelizeBeninBermudaBhutanBoliviaBosnia and HerzegovinaBotswanaBrazilBrunei DarussalamBulgariaBurkina FasoBurundiCabo VerdeCambodiaCameroonCanadaCaribbean small statesCentral African RepublicCentral Europe and the BalticsChadChileChinaColombiaComorosCongo, Dem. Rep.Congo, Rep.Costa RicaCote d'IvoireCroatiaCuracaoCyprusCzech RepublicDenmarkDjiboutiDominicaDominican RepublicEarly-demographic dividendEast Asia & PacificEast Asia & Pacific (excluding high income)East Asia & Pacific (IDA & IBRD countries)EcuadorEgypt, Arab Rep.El SalvadorEquatorial GuineaEritreaEstoniaEthiopiaEuro areaEurope & Central AsiaEurope & Central Asia (excluding high income)Europe & Central Asia (IDA & IBRD countries)European UnionFaroe IslandsFijiFinlandFragile and conflict affected situationsFranceFrench PolynesiaGabonGambia, TheGeorgiaGermanyGhanaGreeceGrenadaGuatemalaGuineaGuinea-BissauGuyanaHaitiHeavily indebted poor countries (HIPC)High incomeHondurasHong Kong SAR, ChinaHungaryIBRD onlyIcelandIDA & IBRD totalIDA blendIDA onlyIDA totalIndiaIndonesiaIran, Islamic Rep.IraqIrelandIsraelItalyJamaicaJapanJordanKazakhstanKenyaKiribatiKorea, Rep.KosovoKuwaitKyrgyz RepublicLao PDRLate-demographic dividendLatin America & Caribbean Latin America & Caribbean (excluding high income)Latin America & the Caribbean (IDA & IBRD countries)LatviaLeast developed countries: UN classificationLebanonLesothoLiberiaLibyaLithuaniaLow & middle incomeLow incomeLower middle incomeLuxembourgMacao SAR, ChinaMacedonia, FYRMadagascarMalawiMalaysiaMaldivesMaliMaltaMarshall IslandsMauritaniaMauritiusMexicoMicronesia, Fed. Sts.Middle East & North Africa (excluding high income)Middle East & North Africa (IDA & IBRD countries)Middle incomeMoldovaMongoliaMontenegroMoroccoMozambiqueMyanmarNamibiaNepalNetherlandsNew CaledoniaNicaraguaNigerNigeriaNorth AmericaNorwayOECD membersOmanOther small statesPacific island small statesPakistanPalauPanamaPapua New GuineaParaguayPeruPhilippinesPolandPortugalPost-demographic dividendPre-demographic dividendQatarRomaniaRussian FederationRwandaSamoaSao Tome and PrincipeSaudi ArabiaSenegalSerbiaSeychellesSierra LeoneSingaporeSint Maarten (Dutch part)Slovak RepublicSloveniaSmall statesSolomon IslandsSouth AfricaSouth AsiaSouth Asia (IDA & IBRD)South SudanSpainSri LankaSt. Kitts and NevisSt. LuciaSt. Vincent and the GrenadinesSub-Saharan Africa Sub-Saharan Africa (excluding high income)Sub-Saharan Africa (IDA & IBRD countries)SudanSurinameSwazilandSwedenSwitzerlandSyrian Arab RepublicTajikistanTanzaniaThailandTimor-LesteTogoTongaTrinidad and TobagoTunisiaTurkeyTuvaluUgandaUkraineUnited KingdomUnited StatesUpper middle incomeUruguayVanuatuVenezuela, RBVietnamWest Bank and GazaWorldYemen, Rep.ZambiaZimbabwe Timeline:
This timeline shows a graph from 1978 to 2016 of Panama. No data until 1977. Number of actual observations by date: 39.
Source name:
World Development Indicators
Source organization:
International Monetary Fund, Balance of Payments Statistics Yearbook and data files.
Categories, topics:
Economy & Growth, External Debt, Trade
Last updated:
apr 23, 2017
Indicators value changes by year
Minimum:
1.541 bln
jan 1, 1978
Maximum:
36.62 bln
jan 1, 2013
At the date of observation
Value
Absolute change
Change from previous value
jan 1, 1978
1.541 bln
+1.541 bln
0.0%
jan 1, 1979
1.949 bln
+408.1 mln
26.48%
jan 1, 1980
2.907 bln
+957.5 mln
49.12%
jan 1, 1981
8.222 bln
+5.315 bln
182.86%
jan 1, 1982
9.706 bln
+1.484 bln
18.05%
jan 1, 1983
9.746 bln
+39.4 mln
0.41%
jan 1, 1984
7.261 bln
-2.485 bln
-25.5%
jan 1, 1985
6.953 bln
-308.2 mln
-4.24%
jan 1, 1986
6.468 bln
-484.2 mln
-6.96%
jan 1, 1987
6.432 bln
-36.4 mln
-0.56%
jan 1, 1988
5.606 bln
-825.6 mln
-12.84%
jan 1, 1989
3.931 bln
-1.675 bln
-29.88%
jan 1, 1990
4.684 bln
+752.4 mln
19.14%
jan 1, 1991
5.588 bln
+903.9 mln
19.3%
jan 1, 1992
6.95 bln
+1.363 bln
24.39%
jan 1, 1993
7.937 bln
+986.2 mln
14.19%
jan 1, 1994
8.068 bln
+131.1 mln
1.65%
jan 1, 1995
8.784 bln
+716.6 mln
8.88%
jan 1, 1996
9.878 bln
+1.093 bln
12.44%
jan 1, 1997
9.172 bln
-705.3 mln
-7.14%
jan 1, 1998
10.474 bln
+1.302 bln
14.19%
jan 1, 1999
11.041 bln
+567.6 mln
5.42%
jan 1, 2000
9.939 bln
-1.103 bln
-9.99%
jan 1, 2001
10.233 bln
+294.6 mln
2.96%
jan 1, 2002
9.749 bln
-484.0 mln
-4.73%
jan 1, 2003
8.863 bln
-886.877 mln
-9.1%
jan 1, 2004
9.168 bln
+305.077 mln
3.44%
jan 1, 2005
10.842 bln
+1.675 bln
18.27%
jan 1, 2006
12.883 bln
+2.041 bln
18.83%
jan 1, 2007
14.547 bln
+1.663 bln
12.91%
jan 1, 2008
18.75 bln
+4.203 bln
28.89%
jan 1, 2009
24.1 bln
+5.35 bln
28.53%
jan 1, 2010
20.455 bln
-3.645 bln
-15.12%
jan 1, 2011
25.244 bln
+4.789 bln
23.41%
jan 1, 2012
33.671 bln
+8.427 bln
33.38%
jan 1, 2013
36.62 bln
+2.949 bln
8.76%
jan 1, 2014
36.397 bln
-223.5 mln
-0.61%
jan 1, 2015
35.136 bln
-1.261 bln
-3.46%
jan 1, 2016
32.673 bln
-2.463 bln
-7.01%
Ranking of countries by current statistics by years


Comments: