29
/
en
AIzaSyAYiBZKx7MnpbEhh9jyipgxe19OcubqV5w
April 1, 2024
266965
Trinidad and Tobago
TTO
true
2
1
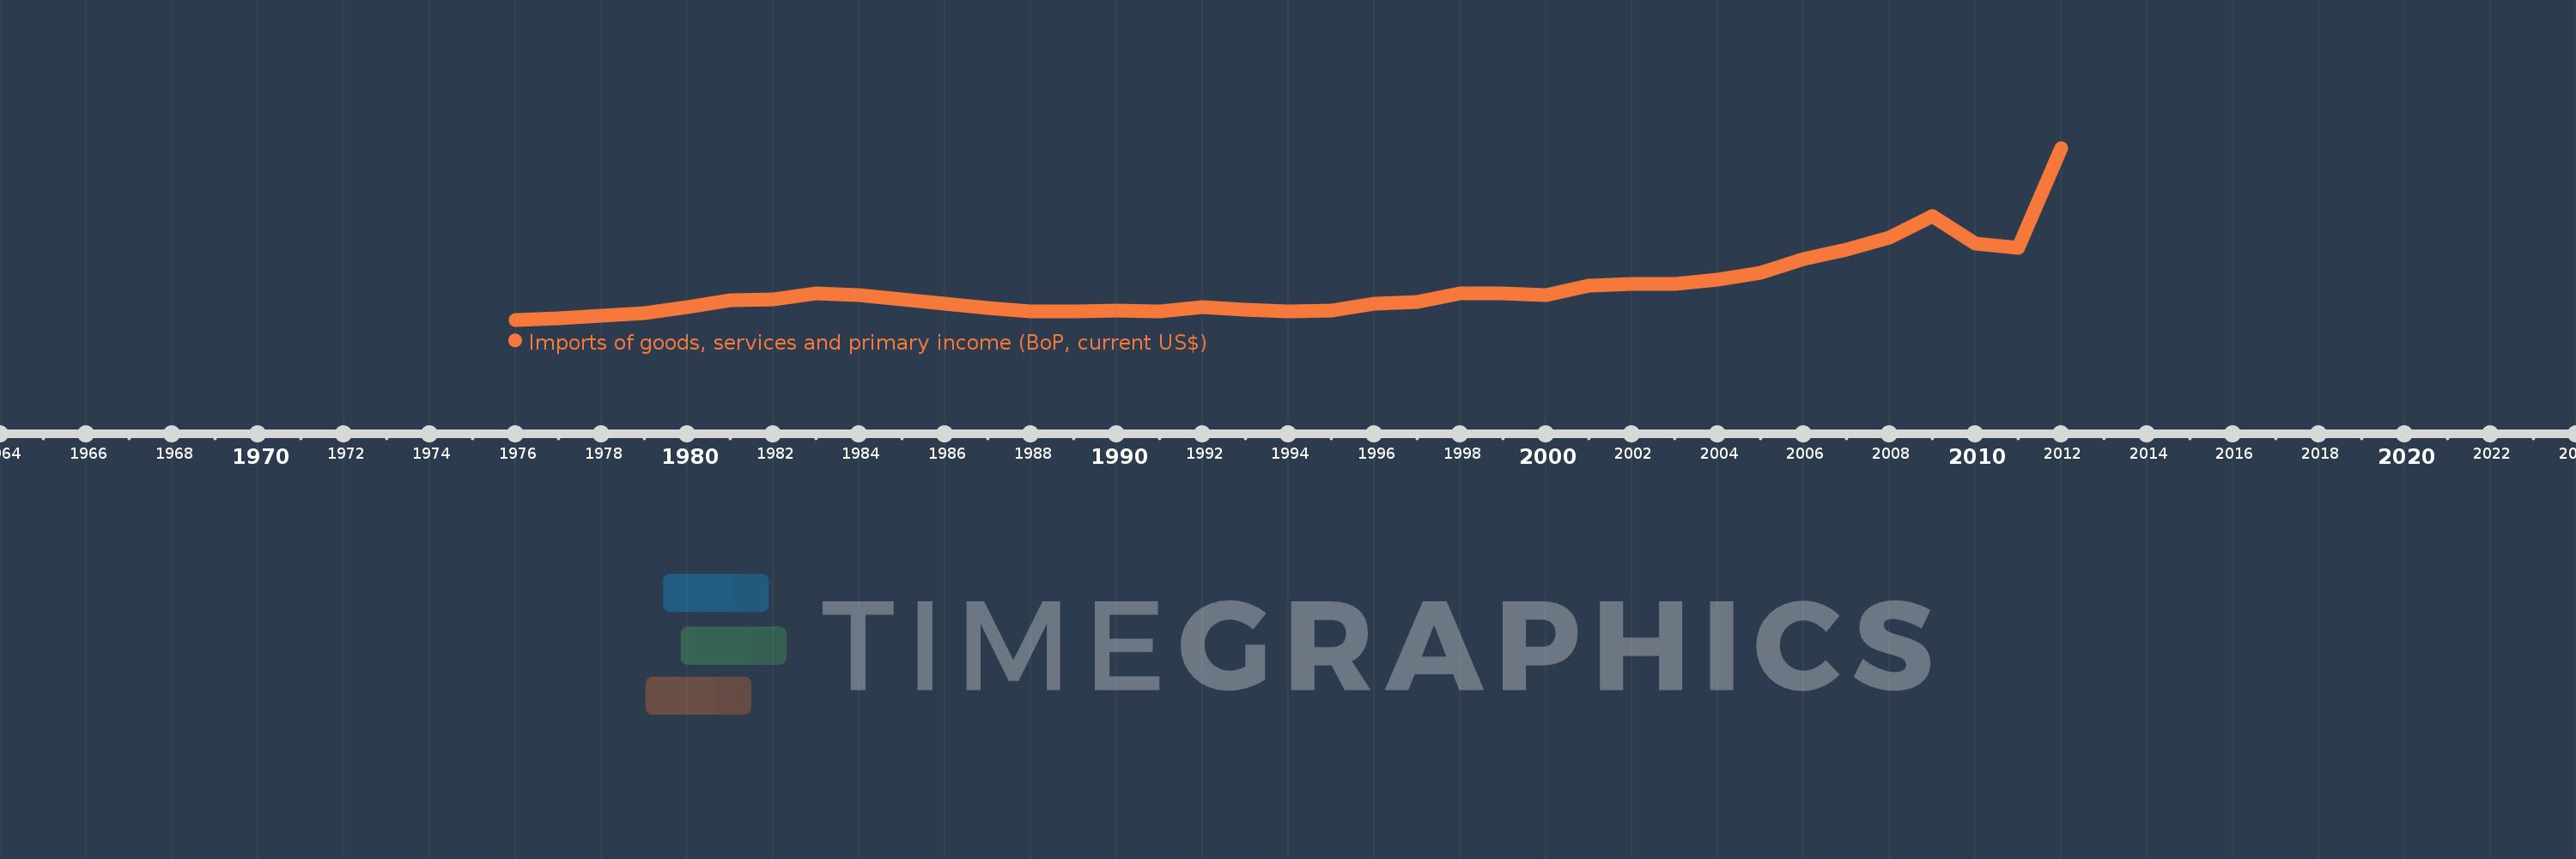
Imports of goods, services and primary income (BoP, current US$)
2012,2011,2010,2009,2008,2007,2006,2005,2004,2003,2002,2001,2000,1999,1998,1997,1996,1995,1994,1993,1992,1991,1990,1989,1988,1987,1986,1985,1984,1983,1982,1981,1980,1979,1978,1977,1976
This statistics in other country:
AfghanistanAlbaniaAlgeriaAngolaAntigua and BarbudaArab WorldArgentinaArmeniaArubaAustraliaAustriaAzerbaijanBahamas, TheBahrainBangladeshBarbadosBelarusBelgiumBelizeBeninBermudaBhutanBoliviaBosnia and HerzegovinaBotswanaBrazilBrunei DarussalamBulgariaBurkina FasoBurundiCabo VerdeCambodiaCameroonCanadaCaribbean small statesCentral African RepublicCentral Europe and the BalticsChadChileChinaColombiaComorosCongo, Dem. Rep.Congo, Rep.Costa RicaCote d'IvoireCroatiaCuracaoCyprusCzech RepublicDenmarkDjiboutiDominicaDominican RepublicEarly-demographic dividendEast Asia & PacificEast Asia & Pacific (excluding high income)East Asia & Pacific (IDA & IBRD countries)EcuadorEgypt, Arab Rep.El SalvadorEquatorial GuineaEritreaEstoniaEthiopiaEuro areaEurope & Central AsiaEurope & Central Asia (excluding high income)Europe & Central Asia (IDA & IBRD countries)European UnionFaroe IslandsFijiFinlandFragile and conflict affected situationsFranceFrench PolynesiaGabonGambia, TheGeorgiaGermanyGhanaGreeceGrenadaGuatemalaGuineaGuinea-BissauGuyanaHaitiHeavily indebted poor countries (HIPC)High incomeHondurasHong Kong SAR, ChinaHungaryIBRD onlyIcelandIDA & IBRD totalIDA blendIDA onlyIDA totalIndiaIndonesiaIran, Islamic Rep.IraqIrelandIsraelItalyJamaicaJapanJordanKazakhstanKenyaKiribatiKorea, Rep.KosovoKuwaitKyrgyz RepublicLao PDRLate-demographic dividendLatin America & Caribbean Latin America & Caribbean (excluding high income)Latin America & the Caribbean (IDA & IBRD countries)LatviaLeast developed countries: UN classificationLebanonLesothoLiberiaLibyaLithuaniaLow & middle incomeLow incomeLower middle incomeLuxembourgMacao SAR, ChinaMacedonia, FYRMadagascarMalawiMalaysiaMaldivesMaliMaltaMarshall IslandsMauritaniaMauritiusMexicoMicronesia, Fed. Sts.Middle East & North Africa (excluding high income)Middle East & North Africa (IDA & IBRD countries)Middle incomeMoldovaMongoliaMontenegroMoroccoMozambiqueMyanmarNamibiaNepalNetherlandsNew CaledoniaNicaraguaNigerNigeriaNorth AmericaNorwayOECD membersOmanOther small statesPacific island small statesPakistanPalauPanamaPapua New GuineaParaguayPeruPhilippinesPolandPortugalPost-demographic dividendPre-demographic dividendQatarRomaniaRussian FederationRwandaSamoaSao Tome and PrincipeSaudi ArabiaSenegalSerbiaSeychellesSierra LeoneSingaporeSint Maarten (Dutch part)Slovak RepublicSloveniaSmall statesSolomon IslandsSouth AfricaSouth AsiaSouth Asia (IDA & IBRD)South SudanSpainSri LankaSt. Kitts and NevisSt. LuciaSt. Vincent and the GrenadinesSub-Saharan Africa Sub-Saharan Africa (excluding high income)Sub-Saharan Africa (IDA & IBRD countries)SudanSurinameSwazilandSwedenSwitzerlandSyrian Arab RepublicTajikistanTanzaniaThailandTimor-LesteTogoTongaTrinidad and TobagoTunisiaTurkeyTuvaluUgandaUkraineUnited KingdomUnited StatesUpper middle incomeUruguayVanuatuVenezuela, RBVietnamWest Bank and GazaWorldYemen, Rep.ZambiaZimbabwe Timeline:
This timeline shows a graph from 1976 to 2012 of Trinidad and Tobago. No data until 1975. Number of actual observations by date: 37.
Source name:
World Development Indicators
Source organization:
International Monetary Fund, Balance of Payments Statistics Yearbook and data files.
Categories, topics:
Economy & Growth, External Debt, Trade
Last updated:
apr 23, 2017
Indicators value changes by year
Minimum:
980.23 mln
jan 1, 1976
Maximum:
18.296 bln
jan 1, 2012
At the date of observation
Value
Absolute change
Change from previous value
jan 1, 1976
980.23 mln
+980.23 mln
0.0%
jan 1, 1977
1.166 bln
+185.308 mln
18.9%
jan 1, 1978
1.42 bln
+254.671 mln
21.85%
jan 1, 1979
1.609 bln
+188.833 mln
13.3%
jan 1, 1980
2.216 bln
+606.75 mln
37.71%
jan 1, 1981
2.972 bln
+756.5 mln
34.14%
jan 1, 1982
3.021 bln
+49.083 mln
1.65%
jan 1, 1983
3.651 bln
+629.667 mln
20.84%
jan 1, 1984
3.498 bln
-152.875 mln
-4.19%
jan 1, 1985
3.021 bln
-477.667 mln
-13.65%
jan 1, 1986
2.625 bln
-395.276 mln
-13.09%
jan 1, 1987
2.13 bln
-494.836 mln
-18.85%
jan 1, 1988
1.843 bln
-287.528 mln
-13.5%
jan 1, 1989
1.84 bln
-2.471 mln
-0.13%
jan 1, 1990
1.895 bln
+54.716 mln
2.97%
jan 1, 1991
1.863 bln
-32.0 mln
-1.69%
jan 1, 1992
2.235 bln
+372.282 mln
19.98%
jan 1, 1993
2.035 bln
-200.024 mln
-8.95%
jan 1, 1994
1.785 bln
-250.03 mln
-12.28%
jan 1, 1995
1.943 bln
+158.098 mln
8.86%
jan 1, 1996
2.577 bln
+633.606 mln
32.6%
jan 1, 1997
2.742 bln
+165.179 mln
6.41%
jan 1, 1998
3.676 bln
+933.419 mln
34.04%
jan 1, 1999
3.66 bln
-16.114 mln
-0.44%
jan 1, 2000
3.474 bln
-185.423 mln
-5.07%
jan 1, 2001
4.403 bln
+929.3 mln
26.75%
jan 1, 2002
4.594 bln
+191.0 mln
4.34%
jan 1, 2003
4.589 bln
-5.4 mln
-0.12%
jan 1, 2004
5.033 bln
+444.0 mln
9.68%
jan 1, 2005
5.714 bln
+680.6 mln
13.52%
jan 1, 2006
7.131 bln
+1.418 bln
24.81%
jan 1, 2007
8.072 bln
+940.5 mln
13.19%
jan 1, 2008
9.282 bln
+1.211 bln
15.0%
jan 1, 2009
11.415 bln
+2.133 bln
22.98%
jan 1, 2010
8.661 bln
-2.754 bln
-24.13%
jan 1, 2011
8.25 bln
-410.9 mln
-4.74%
jan 1, 2012
18.296 bln
+10.046 bln
121.78%
Ranking of countries by current statistics by years


Comments: