29
/
en
AIzaSyAYiBZKx7MnpbEhh9jyipgxe19OcubqV5w
April 1, 2024
156120
Indonesia
IDN
true
2
1
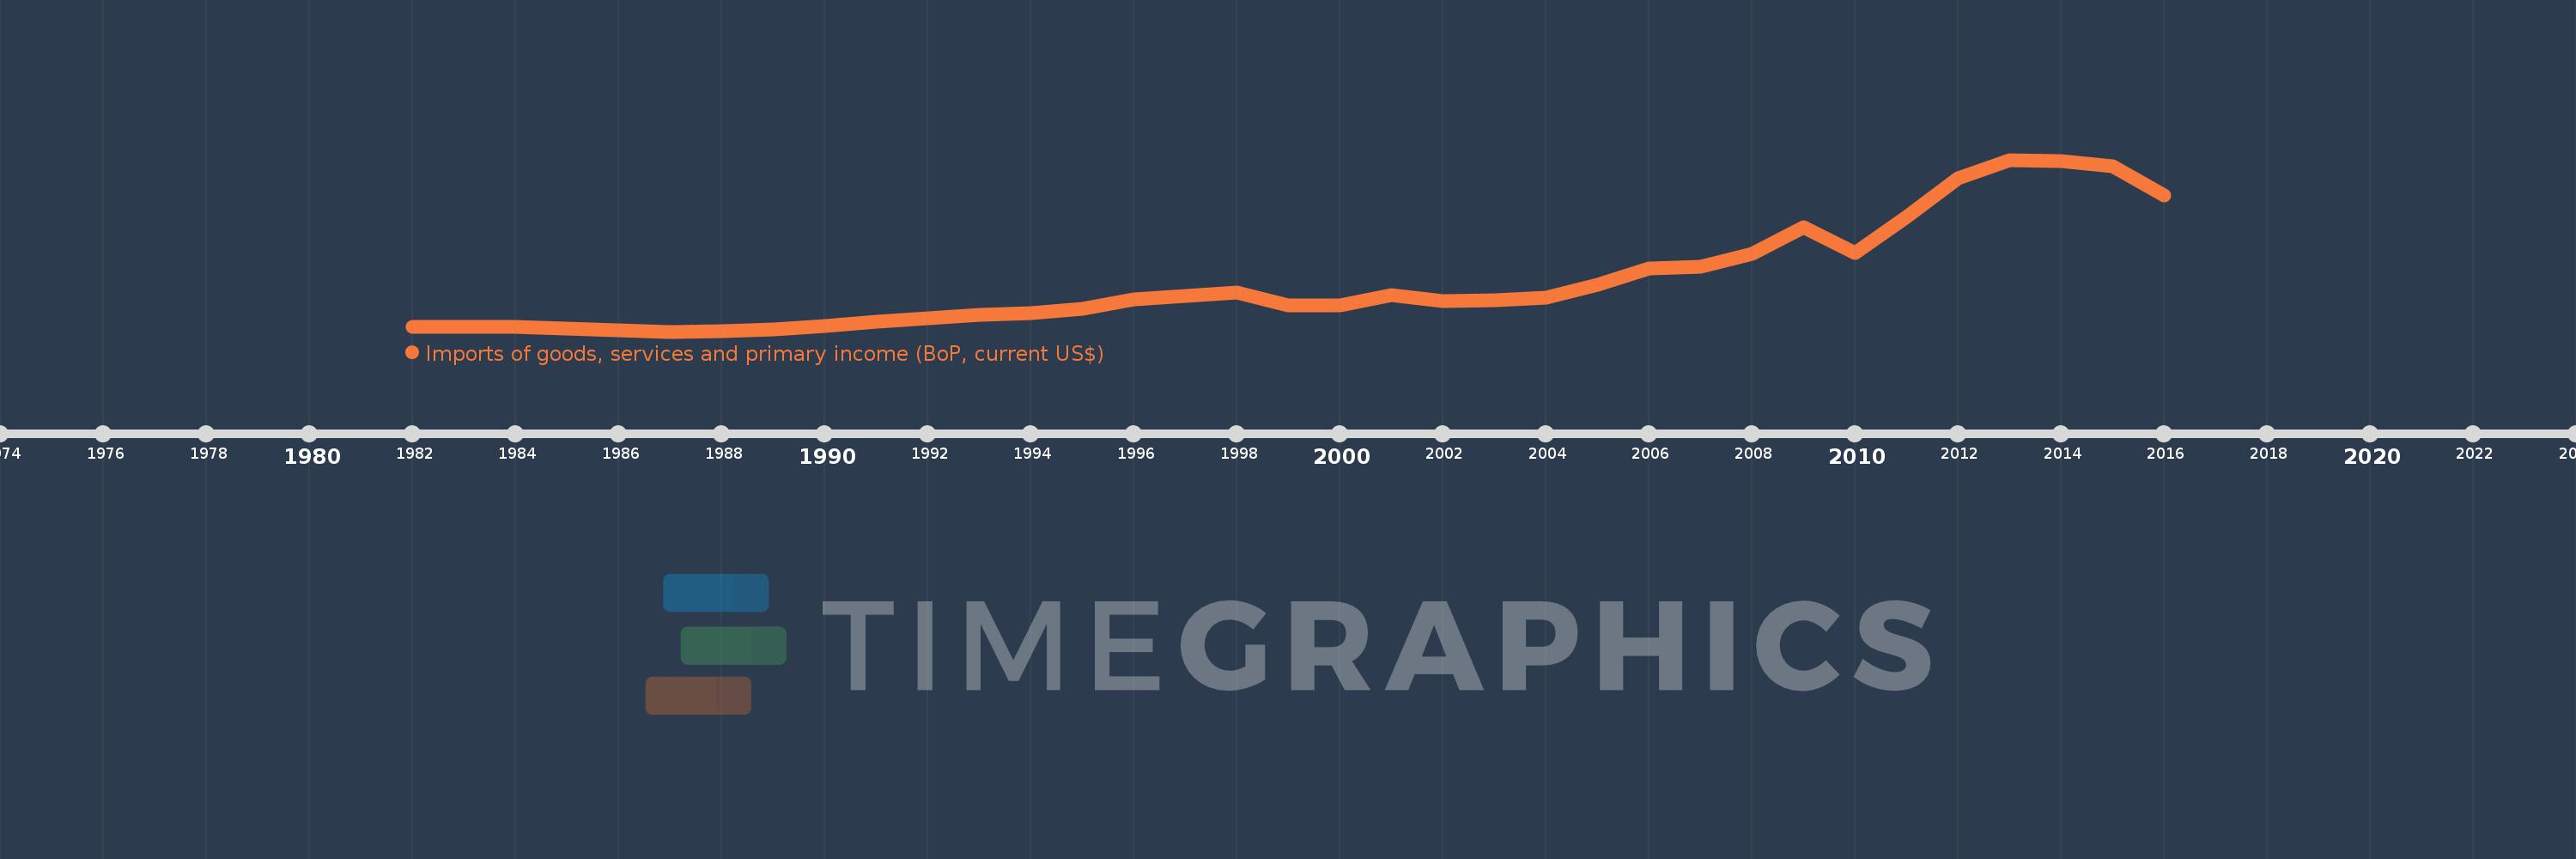
Imports of goods, services and primary income (BoP, current US$)
2016,2015,2014,2013,2012,2011,2010,2009,2008,2007,2006,2005,2004,2003,2002,2001,2000,1999,1998,1997,1996,1995,1994,1993,1992,1991,1990,1989,1988,1987,1986,1985,1984,1983,1982
This statistics in other country:
AfghanistanAlbaniaAlgeriaAngolaAntigua and BarbudaArab WorldArgentinaArmeniaArubaAustraliaAustriaAzerbaijanBahamas, TheBahrainBangladeshBarbadosBelarusBelgiumBelizeBeninBermudaBhutanBoliviaBosnia and HerzegovinaBotswanaBrazilBrunei DarussalamBulgariaBurkina FasoBurundiCabo VerdeCambodiaCameroonCanadaCaribbean small statesCentral African RepublicCentral Europe and the BalticsChadChileChinaColombiaComorosCongo, Dem. Rep.Congo, Rep.Costa RicaCote d'IvoireCroatiaCuracaoCyprusCzech RepublicDenmarkDjiboutiDominicaDominican RepublicEarly-demographic dividendEast Asia & PacificEast Asia & Pacific (excluding high income)East Asia & Pacific (IDA & IBRD countries)EcuadorEgypt, Arab Rep.El SalvadorEquatorial GuineaEritreaEstoniaEthiopiaEuro areaEurope & Central AsiaEurope & Central Asia (excluding high income)Europe & Central Asia (IDA & IBRD countries)European UnionFaroe IslandsFijiFinlandFragile and conflict affected situationsFranceFrench PolynesiaGabonGambia, TheGeorgiaGermanyGhanaGreeceGrenadaGuatemalaGuineaGuinea-BissauGuyanaHaitiHeavily indebted poor countries (HIPC)High incomeHondurasHong Kong SAR, ChinaHungaryIBRD onlyIcelandIDA & IBRD totalIDA blendIDA onlyIDA totalIndiaIndonesiaIran, Islamic Rep.IraqIrelandIsraelItalyJamaicaJapanJordanKazakhstanKenyaKiribatiKorea, Rep.KosovoKuwaitKyrgyz RepublicLao PDRLate-demographic dividendLatin America & Caribbean Latin America & Caribbean (excluding high income)Latin America & the Caribbean (IDA & IBRD countries)LatviaLeast developed countries: UN classificationLebanonLesothoLiberiaLibyaLithuaniaLow & middle incomeLow incomeLower middle incomeLuxembourgMacao SAR, ChinaMacedonia, FYRMadagascarMalawiMalaysiaMaldivesMaliMaltaMarshall IslandsMauritaniaMauritiusMexicoMicronesia, Fed. Sts.Middle East & North Africa (excluding high income)Middle East & North Africa (IDA & IBRD countries)Middle incomeMoldovaMongoliaMontenegroMoroccoMozambiqueMyanmarNamibiaNepalNetherlandsNew CaledoniaNicaraguaNigerNigeriaNorth AmericaNorwayOECD membersOmanOther small statesPacific island small statesPakistanPalauPanamaPapua New GuineaParaguayPeruPhilippinesPolandPortugalPost-demographic dividendPre-demographic dividendQatarRomaniaRussian FederationRwandaSamoaSao Tome and PrincipeSaudi ArabiaSenegalSerbiaSeychellesSierra LeoneSingaporeSint Maarten (Dutch part)Slovak RepublicSloveniaSmall statesSolomon IslandsSouth AfricaSouth AsiaSouth Asia (IDA & IBRD)South SudanSpainSri LankaSt. Kitts and NevisSt. LuciaSt. Vincent and the GrenadinesSub-Saharan Africa Sub-Saharan Africa (excluding high income)Sub-Saharan Africa (IDA & IBRD countries)SudanSurinameSwazilandSwedenSwitzerlandSyrian Arab RepublicTajikistanTanzaniaThailandTimor-LesteTogoTongaTrinidad and TobagoTunisiaTurkeyTuvaluUgandaUkraineUnited KingdomUnited StatesUpper middle incomeUruguayVanuatuVenezuela, RBVietnamWest Bank and GazaWorldYemen, Rep.ZambiaZimbabwe Timeline:
This timeline shows a graph from 1982 to 2016 of Indonesia. No data until 1981. Number of actual observations by date: 35.
Source name:
World Development Indicators
Source organization:
International Monetary Fund, Balance of Payments Statistics Yearbook and data files.
Categories, topics:
Economy & Growth, External Debt, Trade
Last updated:
apr 23, 2017
Indicators value changes by year
Minimum:
20.142 bln
jan 1, 1987
Maximum:
242.168 bln
jan 1, 2013
At the date of observation
Value
Absolute change
Change from previous value
jan 1, 1982
25.694 bln
+25.694 bln
0.0%
jan 1, 1983
26.732 bln
+1.038 bln
4.04%
jan 1, 1984
26.318 bln
-414.0 mln
-1.55%
jan 1, 1985
24.175 bln
-2.143 bln
-8.14%
jan 1, 1986
22.15 bln
-2.025 bln
-8.38%
jan 1, 1987
20.142 bln
-2.008 bln
-9.07%
jan 1, 1988
21.187 bln
+1.045 bln
5.19%
jan 1, 1989
23.021 bln
+1.834 bln
8.66%
jan 1, 1990
26.858 bln
+3.837 bln
16.67%
jan 1, 1991
33.11 bln
+6.252 bln
23.28%
jan 1, 1992
37.896 bln
+4.786 bln
14.45%
jan 1, 1993
41.356 bln
+3.46 bln
9.13%
jan 1, 1994
44.237 bln
+2.881 bln
6.97%
jan 1, 1995
49.479 bln
+5.242 bln
11.85%
jan 1, 1996
61.641 bln
+12.162 bln
24.58%
jan 1, 1997
66.597 bln
+4.956 bln
8.04%
jan 1, 1998
71.017 bln
+4.42 bln
6.64%
jan 1, 1999
54.129 bln
-16.888 bln
-23.78%
jan 1, 2000
53.862 bln
-267.485 mln
-0.49%
jan 1, 2001
66.903 bln
+13.042 bln
24.21%
jan 1, 2002
59.489 bln
-7.415 bln
-11.08%
jan 1, 2003
61.062 bln
+1.574 bln
2.65%
jan 1, 2004
64.219 bln
+3.156 bln
5.17%
jan 1, 2005
80.384 bln
+16.166 bln
25.17%
jan 1, 2006
101.533 bln
+21.148 bln
26.31%
jan 1, 2007
103.991 bln
+2.458 bln
2.42%
jan 1, 2008
120.348 bln
+16.357 bln
15.73%
jan 1, 2009
154.885 bln
+34.537 bln
28.7%
jan 1, 2010
121.192 bln
-33.692 bln
-21.75%
jan 1, 2011
168.056 bln
+46.864 bln
38.67%
jan 1, 2012
218.103 bln
+50.047 bln
29.78%
jan 1, 2013
242.168 bln
+24.065 bln
11.03%
jan 1, 2014
240.922 bln
-1.246 bln
-0.51%
jan 1, 2015
233.683 bln
-7.239 bln
-3.0%
jan 1, 2016
196.625 bln
-37.058 bln
-15.86%
Ranking of countries by current statistics by years


Comments: