29
/
en
AIzaSyAYiBZKx7MnpbEhh9jyipgxe19OcubqV5w
April 1, 2024
143100
Grenada
GRD
true
2
1
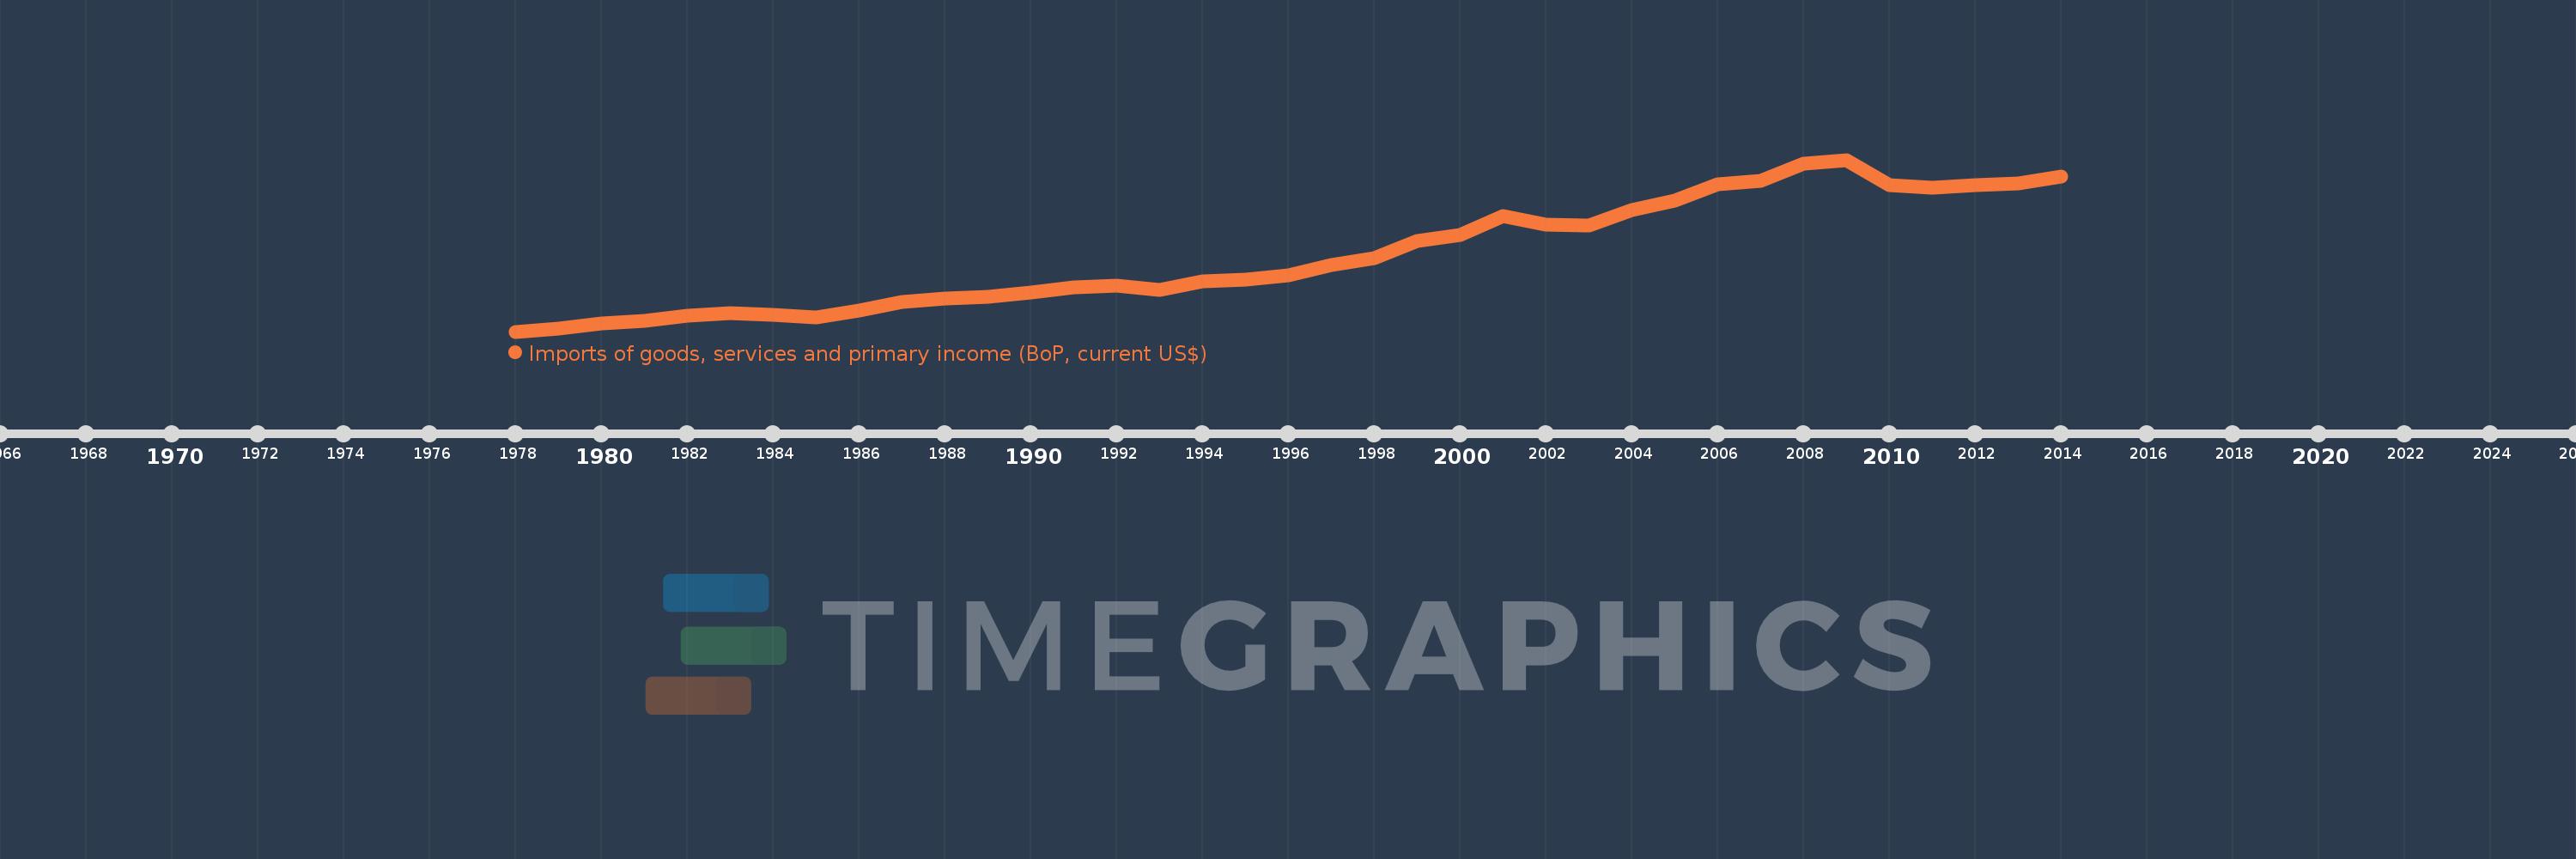
Imports of goods, services and primary income (BoP, current US$)
2014,2013,2012,2011,2010,2009,2008,2007,2006,2005,2004,2003,2002,2001,2000,1999,1998,1997,1996,1995,1994,1993,1992,1991,1990,1989,1988,1987,1986,1985,1984,1983,1982,1981,1980,1979,1978
This statistics in other country:
AfghanistanAlbaniaAlgeriaAngolaAntigua and BarbudaArab WorldArgentinaArmeniaArubaAustraliaAustriaAzerbaijanBahamas, TheBahrainBangladeshBarbadosBelarusBelgiumBelizeBeninBermudaBhutanBoliviaBosnia and HerzegovinaBotswanaBrazilBrunei DarussalamBulgariaBurkina FasoBurundiCabo VerdeCambodiaCameroonCanadaCaribbean small statesCentral African RepublicCentral Europe and the BalticsChadChileChinaColombiaComorosCongo, Dem. Rep.Congo, Rep.Costa RicaCote d'IvoireCroatiaCuracaoCyprusCzech RepublicDenmarkDjiboutiDominicaDominican RepublicEarly-demographic dividendEast Asia & PacificEast Asia & Pacific (excluding high income)East Asia & Pacific (IDA & IBRD countries)EcuadorEgypt, Arab Rep.El SalvadorEquatorial GuineaEritreaEstoniaEthiopiaEuro areaEurope & Central AsiaEurope & Central Asia (excluding high income)Europe & Central Asia (IDA & IBRD countries)European UnionFaroe IslandsFijiFinlandFragile and conflict affected situationsFranceFrench PolynesiaGabonGambia, TheGeorgiaGermanyGhanaGreeceGrenadaGuatemalaGuineaGuinea-BissauGuyanaHaitiHeavily indebted poor countries (HIPC)High incomeHondurasHong Kong SAR, ChinaHungaryIBRD onlyIcelandIDA & IBRD totalIDA blendIDA onlyIDA totalIndiaIndonesiaIran, Islamic Rep.IraqIrelandIsraelItalyJamaicaJapanJordanKazakhstanKenyaKiribatiKorea, Rep.KosovoKuwaitKyrgyz RepublicLao PDRLate-demographic dividendLatin America & Caribbean Latin America & Caribbean (excluding high income)Latin America & the Caribbean (IDA & IBRD countries)LatviaLeast developed countries: UN classificationLebanonLesothoLiberiaLibyaLithuaniaLow & middle incomeLow incomeLower middle incomeLuxembourgMacao SAR, ChinaMacedonia, FYRMadagascarMalawiMalaysiaMaldivesMaliMaltaMarshall IslandsMauritaniaMauritiusMexicoMicronesia, Fed. Sts.Middle East & North Africa (excluding high income)Middle East & North Africa (IDA & IBRD countries)Middle incomeMoldovaMongoliaMontenegroMoroccoMozambiqueMyanmarNamibiaNepalNetherlandsNew CaledoniaNicaraguaNigerNigeriaNorth AmericaNorwayOECD membersOmanOther small statesPacific island small statesPakistanPalauPanamaPapua New GuineaParaguayPeruPhilippinesPolandPortugalPost-demographic dividendPre-demographic dividendQatarRomaniaRussian FederationRwandaSamoaSao Tome and PrincipeSaudi ArabiaSenegalSerbiaSeychellesSierra LeoneSingaporeSint Maarten (Dutch part)Slovak RepublicSloveniaSmall statesSolomon IslandsSouth AfricaSouth AsiaSouth Asia (IDA & IBRD)South SudanSpainSri LankaSt. Kitts and NevisSt. LuciaSt. Vincent and the GrenadinesSub-Saharan Africa Sub-Saharan Africa (excluding high income)Sub-Saharan Africa (IDA & IBRD countries)SudanSurinameSwazilandSwedenSwitzerlandSyrian Arab RepublicTajikistanTanzaniaThailandTimor-LesteTogoTongaTrinidad and TobagoTunisiaTurkeyTuvaluUgandaUkraineUnited KingdomUnited StatesUpper middle incomeUruguayVanuatuVenezuela, RBVietnamWest Bank and GazaWorldYemen, Rep.ZambiaZimbabwe Timeline:
This timeline shows a graph from 1978 to 2014 of Grenada. No data until 1977. Number of actual observations by date: 37.
Source name:
World Development Indicators
Source organization:
International Monetary Fund, Balance of Payments Statistics Yearbook and data files.
Categories, topics:
Economy & Growth, External Debt, Trade
Last updated:
apr 23, 2017
Indicators value changes by year
Minimum:
33.093 mln
jan 1, 1978
Maximum:
502.527 mln
jan 1, 2009
At the date of observation
Value
Absolute change
Change from previous value
jan 1, 1978
33.093 mln
+33.093 mln
0.0%
jan 1, 1979
40.352 mln
+7.259 mln
21.94%
jan 1, 1980
55.663 mln
+15.311 mln
37.94%
jan 1, 1981
63.059 mln
+7.396 mln
13.29%
jan 1, 1982
75.759 mln
+12.7 mln
20.14%
jan 1, 1983
82.9 mln
+7.141 mln
9.43%
jan 1, 1984
79.8 mln
-3.1 mln
-3.74%
jan 1, 1985
72.4 mln
-7.4 mln
-9.27%
jan 1, 1986
89.73 mln
+17.33 mln
23.94%
jan 1, 1987
113.178 mln
+23.448 mln
26.13%
jan 1, 1988
123.463 mln
+10.285 mln
9.09%
jan 1, 1989
128.889 mln
+5.426 mln
4.39%
jan 1, 1990
140.593 mln
+11.704 mln
9.08%
jan 1, 1991
153.181 mln
+12.589 mln
8.95%
jan 1, 1992
159.804 mln
+6.622 mln
4.32%
jan 1, 1993
147.37 mln
-12.433 mln
-7.78%
jan 1, 1994
170.474 mln
+23.104 mln
15.68%
jan 1, 1995
174.344 mln
+3.87 mln
2.27%
jan 1, 1996
187.567 mln
+13.222 mln
7.58%
jan 1, 1997
214.174 mln
+26.607 mln
14.19%
jan 1, 1998
234.252 mln
+20.078 mln
9.37%
jan 1, 1999
280.548 mln
+46.296 mln
19.76%
jan 1, 2000
296.919 mln
+16.37 mln
5.84%
jan 1, 2001
348.968 mln
+52.05 mln
17.53%
jan 1, 2002
325.385 mln
-23.584 mln
-6.76%
jan 1, 2003
323.801 mln
-1.584 mln
-0.49%
jan 1, 2004
365.688 mln
+41.887 mln
12.94%
jan 1, 2005
390.002 mln
+24.314 mln
6.65%
jan 1, 2006
435.876 mln
+45.873 mln
11.76%
jan 1, 2007
444.536 mln
+8.66 mln
1.99%
jan 1, 2008
491.137 mln
+46.601 mln
10.48%
jan 1, 2009
502.527 mln
+11.39 mln
2.32%
jan 1, 2010
432.148 mln
-70.379 mln
-14.01%
jan 1, 2011
426.598 mln
-5.55 mln
-1.28%
jan 1, 2012
433.038 mln
+6.44 mln
1.51%
jan 1, 2013
436.964 mln
+3.925 mln
0.91%
jan 1, 2014
455.915 mln
+18.952 mln
4.34%
Ranking of countries by current statistics by years


Comments: