29
/
en
AIzaSyAYiBZKx7MnpbEhh9jyipgxe19OcubqV5w
April 1, 2024
39999
IDA total
IDA
false
2
1
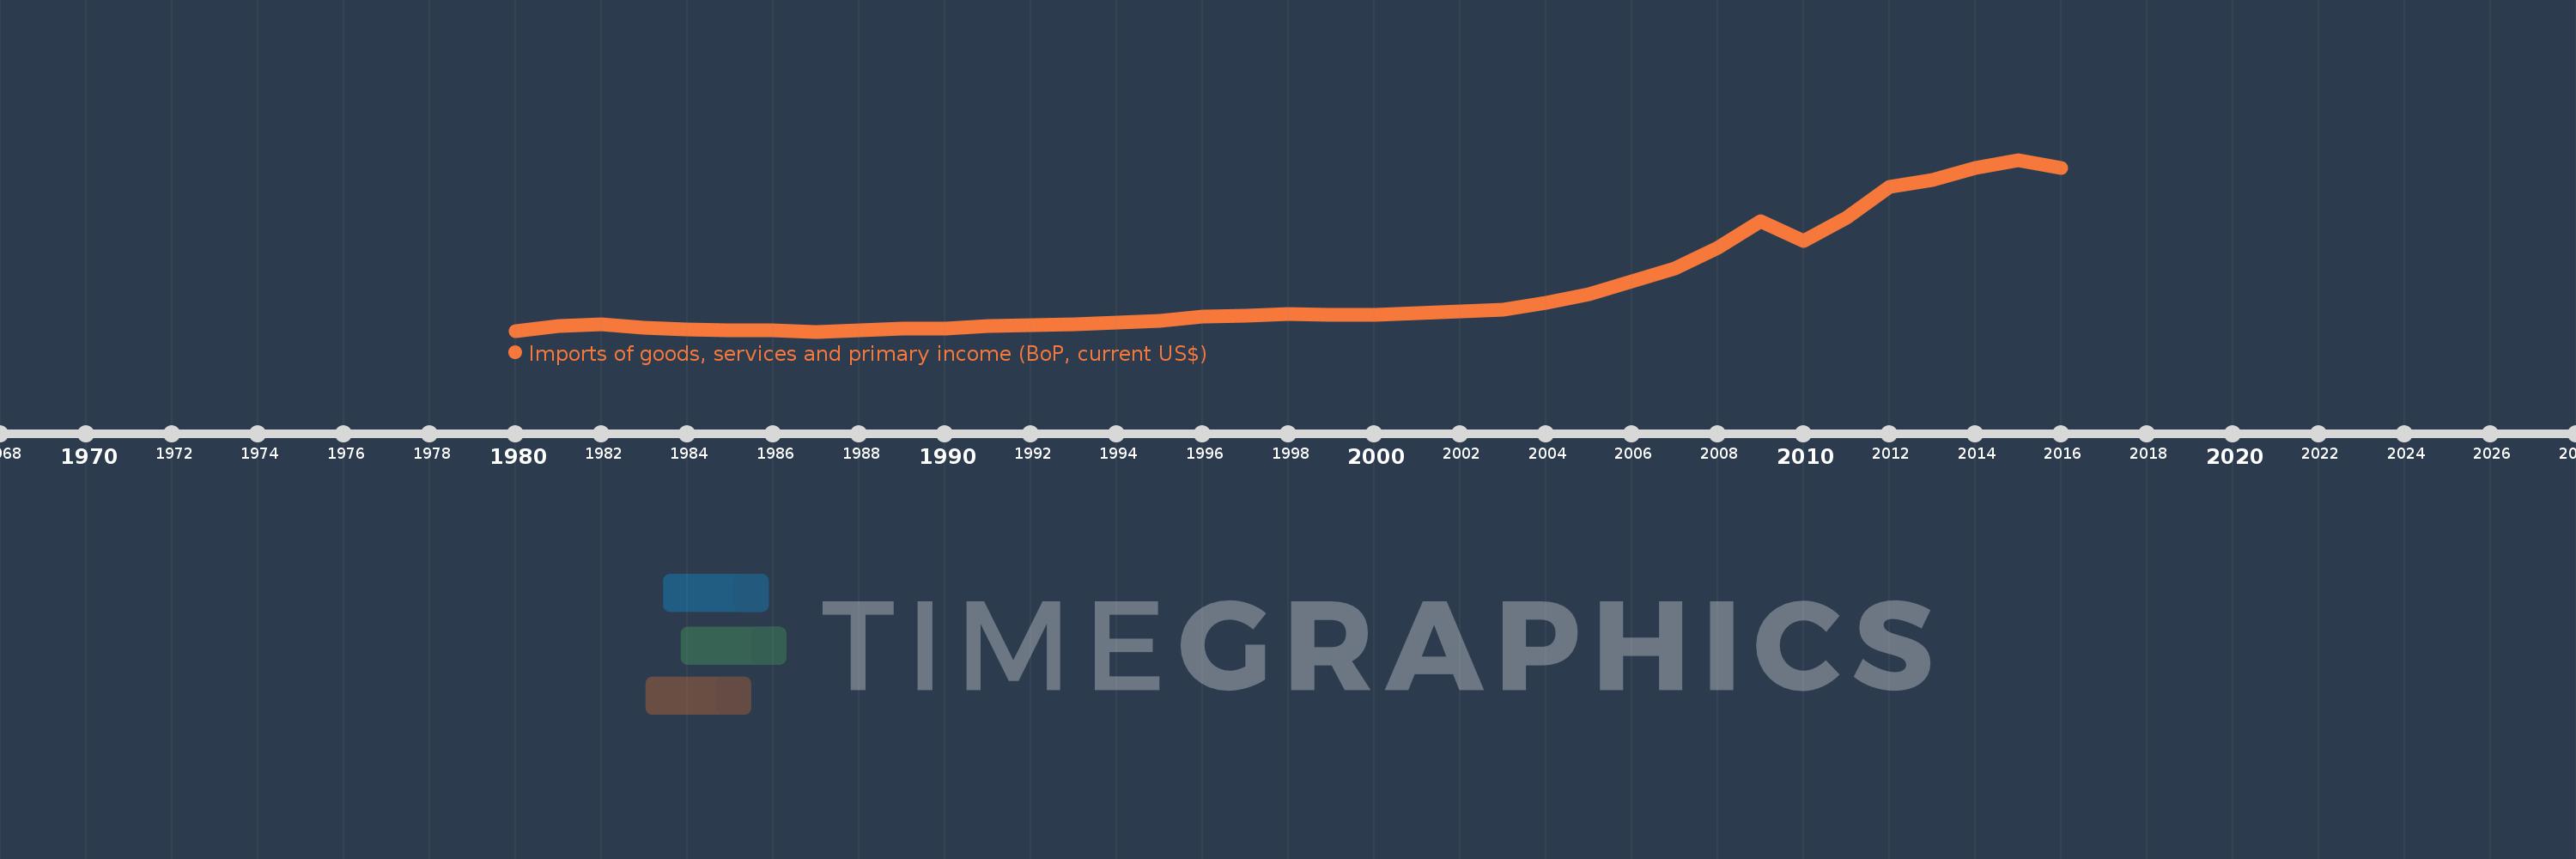
Imports of goods, services and primary income (BoP, current US$)
2016,2015,2014,2013,2012,2011,2010,2009,2008,2007,2006,2005,2004,2003,2002,2001,2000,1999,1998,1997,1996,1995,1994,1993,1992,1991,1990,1989,1988,1987,1986,1985,1984,1983,1982,1981,1980
This statistics in other country:
AfghanistanAlbaniaAlgeriaAngolaAntigua and BarbudaArab WorldArgentinaArmeniaArubaAustraliaAustriaAzerbaijanBahamas, TheBahrainBangladeshBarbadosBelarusBelgiumBelizeBeninBermudaBhutanBoliviaBosnia and HerzegovinaBotswanaBrazilBrunei DarussalamBulgariaBurkina FasoBurundiCabo VerdeCambodiaCameroonCanadaCaribbean small statesCentral African RepublicCentral Europe and the BalticsChadChileChinaColombiaComorosCongo, Dem. Rep.Congo, Rep.Costa RicaCote d'IvoireCroatiaCuracaoCyprusCzech RepublicDenmarkDjiboutiDominicaDominican RepublicEarly-demographic dividendEast Asia & PacificEast Asia & Pacific (excluding high income)East Asia & Pacific (IDA & IBRD countries)EcuadorEgypt, Arab Rep.El SalvadorEquatorial GuineaEritreaEstoniaEthiopiaEuro areaEurope & Central AsiaEurope & Central Asia (excluding high income)Europe & Central Asia (IDA & IBRD countries)European UnionFaroe IslandsFijiFinlandFragile and conflict affected situationsFranceFrench PolynesiaGabonGambia, TheGeorgiaGermanyGhanaGreeceGrenadaGuatemalaGuineaGuinea-BissauGuyanaHaitiHeavily indebted poor countries (HIPC)High incomeHondurasHong Kong SAR, ChinaHungaryIBRD onlyIcelandIDA & IBRD totalIDA blendIDA onlyIDA totalIndiaIndonesiaIran, Islamic Rep.IraqIrelandIsraelItalyJamaicaJapanJordanKazakhstanKenyaKiribatiKorea, Rep.KosovoKuwaitKyrgyz RepublicLao PDRLate-demographic dividendLatin America & Caribbean Latin America & Caribbean (excluding high income)Latin America & the Caribbean (IDA & IBRD countries)LatviaLeast developed countries: UN classificationLebanonLesothoLiberiaLibyaLithuaniaLow & middle incomeLow incomeLower middle incomeLuxembourgMacao SAR, ChinaMacedonia, FYRMadagascarMalawiMalaysiaMaldivesMaliMaltaMarshall IslandsMauritaniaMauritiusMexicoMicronesia, Fed. Sts.Middle East & North Africa (excluding high income)Middle East & North Africa (IDA & IBRD countries)Middle incomeMoldovaMongoliaMontenegroMoroccoMozambiqueMyanmarNamibiaNepalNetherlandsNew CaledoniaNicaraguaNigerNigeriaNorth AmericaNorwayOECD membersOmanOther small statesPacific island small statesPakistanPalauPanamaPapua New GuineaParaguayPeruPhilippinesPolandPortugalPost-demographic dividendPre-demographic dividendQatarRomaniaRussian FederationRwandaSamoaSao Tome and PrincipeSaudi ArabiaSenegalSerbiaSeychellesSierra LeoneSingaporeSint Maarten (Dutch part)Slovak RepublicSloveniaSmall statesSolomon IslandsSouth AfricaSouth AsiaSouth Asia (IDA & IBRD)South SudanSpainSri LankaSt. Kitts and NevisSt. LuciaSt. Vincent and the GrenadinesSub-Saharan Africa Sub-Saharan Africa (excluding high income)Sub-Saharan Africa (IDA & IBRD countries)SudanSurinameSwazilandSwedenSwitzerlandSyrian Arab RepublicTajikistanTanzaniaThailandTimor-LesteTogoTongaTrinidad and TobagoTunisiaTurkeyTuvaluUgandaUkraineUnited KingdomUnited StatesUpper middle incomeUruguayVanuatuVenezuela, RBVietnamWest Bank and GazaWorldYemen, Rep.ZambiaZimbabwe Timeline:
This timeline shows a graph from 1980 to 2016 of IDA total. No data until 1979. Number of actual observations by date: 37.
Source name:
World Development Indicators
Source organization:
International Monetary Fund, Balance of Payments Statistics Yearbook and data files.
Categories, topics:
Economy & Growth, External Debt, Trade
Last updated:
apr 23, 2017
Indicators value changes by year
Minimum:
71.719 bln
jan 1, 1987
Maximum:
851.058 bln
jan 1, 2015
At the date of observation
Value
Absolute change
Change from previous value
jan 1, 1980
73.404 bln
+73.404 bln
0.0%
jan 1, 1981
95.89 bln
+22.486 bln
30.63%
jan 1, 1982
103.248 bln
+7.359 bln
7.67%
jan 1, 1983
90.109 bln
-13.14 bln
-12.73%
jan 1, 1984
81.043 bln
-9.066 bln
-10.06%
jan 1, 1985
77.63 bln
-3.413 bln
-4.21%
jan 1, 1986
78.114 bln
+483.652 mln
0.62%
jan 1, 1987
71.719 bln
-6.395 bln
-8.19%
jan 1, 1988
79.213 bln
+7.494 bln
10.45%
jan 1, 1989
83.493 bln
+4.281 bln
5.4%
jan 1, 1990
86.179 bln
+2.686 bln
3.22%
jan 1, 1991
95.354 bln
+9.175 bln
10.65%
jan 1, 1992
101.502 bln
+6.148 bln
6.45%
jan 1, 1993
105.816 bln
+4.315 bln
4.25%
jan 1, 1994
111.96 bln
+6.144 bln
5.81%
jan 1, 1995
119.371 bln
+7.411 bln
6.62%
jan 1, 1996
138.75 bln
+19.379 bln
16.23%
jan 1, 1997
143.966 bln
+5.216 bln
3.76%
jan 1, 1998
149.94 bln
+5.974 bln
4.15%
jan 1, 1999
149.587 bln
-352.936 mln
-0.24%
jan 1, 2000
149.097 bln
-490.164 mln
-0.33%
jan 1, 2001
155.354 bln
+6.258 bln
4.2%
jan 1, 2002
162.426 bln
+7.072 bln
4.55%
jan 1, 2003
170.611 bln
+8.185 bln
5.04%
jan 1, 2004
201.269 bln
+30.657 bln
17.97%
jan 1, 2005
241.91 bln
+40.642 bln
20.19%
jan 1, 2006
301.519 bln
+59.609 bln
24.64%
jan 1, 2007
358.376 bln
+56.857 bln
18.86%
jan 1, 2008
450.314 bln
+91.938 bln
25.65%
jan 1, 2009
570.54 bln
+120.226 bln
26.7%
jan 1, 2010
481.54 bln
-89.0 bln
-15.6%
jan 1, 2011
587.23 bln
+105.691 bln
21.95%
jan 1, 2012
729.948 bln
+142.717 bln
24.3%
jan 1, 2013
759.486 bln
+29.538 bln
4.05%
jan 1, 2014
813.29 bln
+53.805 bln
7.08%
jan 1, 2015
851.058 bln
+37.768 bln
4.64%
jan 1, 2016
813.831 bln
-37.228 bln
-4.37%
Ranking of countries by current statistics by years


Comments: