29
/
en
AIzaSyAYiBZKx7MnpbEhh9jyipgxe19OcubqV5w
April 1, 2024
36658
IBRD only
IBD
false
2
1
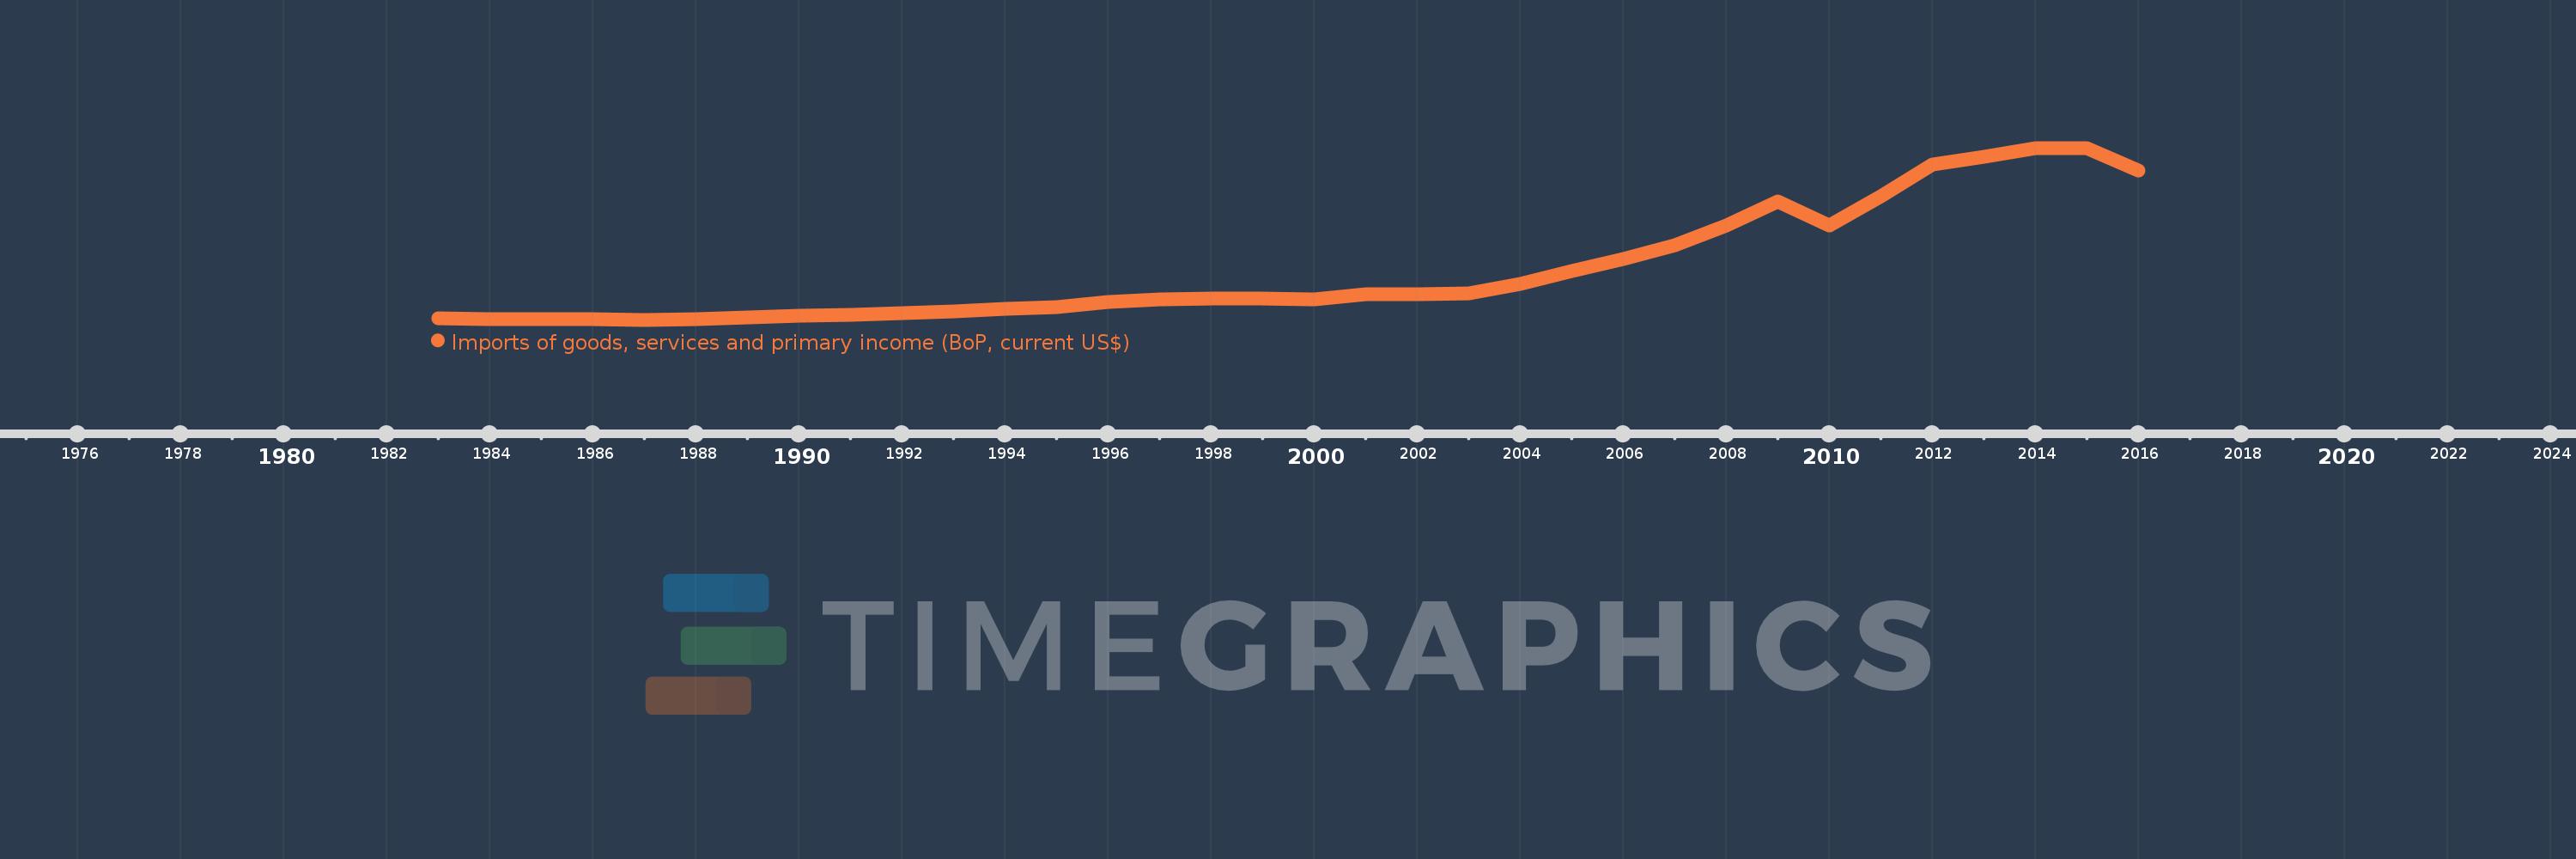
Imports of goods, services and primary income (BoP, current US$)
2016,2015,2014,2013,2012,2011,2010,2009,2008,2007,2006,2005,2004,2003,2002,2001,2000,1999,1998,1997,1996,1995,1994,1993,1992,1991,1990,1989,1988,1987,1986,1985,1984,1983
This statistics in other country:
AfghanistanAlbaniaAlgeriaAngolaAntigua and BarbudaArab WorldArgentinaArmeniaArubaAustraliaAustriaAzerbaijanBahamas, TheBahrainBangladeshBarbadosBelarusBelgiumBelizeBeninBermudaBhutanBoliviaBosnia and HerzegovinaBotswanaBrazilBrunei DarussalamBulgariaBurkina FasoBurundiCabo VerdeCambodiaCameroonCanadaCaribbean small statesCentral African RepublicCentral Europe and the BalticsChadChileChinaColombiaComorosCongo, Dem. Rep.Congo, Rep.Costa RicaCote d'IvoireCroatiaCuracaoCyprusCzech RepublicDenmarkDjiboutiDominicaDominican RepublicEarly-demographic dividendEast Asia & PacificEast Asia & Pacific (excluding high income)East Asia & Pacific (IDA & IBRD countries)EcuadorEgypt, Arab Rep.El SalvadorEquatorial GuineaEritreaEstoniaEthiopiaEuro areaEurope & Central AsiaEurope & Central Asia (excluding high income)Europe & Central Asia (IDA & IBRD countries)European UnionFaroe IslandsFijiFinlandFragile and conflict affected situationsFranceFrench PolynesiaGabonGambia, TheGeorgiaGermanyGhanaGreeceGrenadaGuatemalaGuineaGuinea-BissauGuyanaHaitiHeavily indebted poor countries (HIPC)High incomeHondurasHong Kong SAR, ChinaHungaryIBRD onlyIcelandIDA & IBRD totalIDA blendIDA onlyIDA totalIndiaIndonesiaIran, Islamic Rep.IraqIrelandIsraelItalyJamaicaJapanJordanKazakhstanKenyaKiribatiKorea, Rep.KosovoKuwaitKyrgyz RepublicLao PDRLate-demographic dividendLatin America & Caribbean Latin America & Caribbean (excluding high income)Latin America & the Caribbean (IDA & IBRD countries)LatviaLeast developed countries: UN classificationLebanonLesothoLiberiaLibyaLithuaniaLow & middle incomeLow incomeLower middle incomeLuxembourgMacao SAR, ChinaMacedonia, FYRMadagascarMalawiMalaysiaMaldivesMaliMaltaMarshall IslandsMauritaniaMauritiusMexicoMicronesia, Fed. Sts.Middle East & North Africa (excluding high income)Middle East & North Africa (IDA & IBRD countries)Middle incomeMoldovaMongoliaMontenegroMoroccoMozambiqueMyanmarNamibiaNepalNetherlandsNew CaledoniaNicaraguaNigerNigeriaNorth AmericaNorwayOECD membersOmanOther small statesPacific island small statesPakistanPalauPanamaPapua New GuineaParaguayPeruPhilippinesPolandPortugalPost-demographic dividendPre-demographic dividendQatarRomaniaRussian FederationRwandaSamoaSao Tome and PrincipeSaudi ArabiaSenegalSerbiaSeychellesSierra LeoneSingaporeSint Maarten (Dutch part)Slovak RepublicSloveniaSmall statesSolomon IslandsSouth AfricaSouth AsiaSouth Asia (IDA & IBRD)South SudanSpainSri LankaSt. Kitts and NevisSt. LuciaSt. Vincent and the GrenadinesSub-Saharan Africa Sub-Saharan Africa (excluding high income)Sub-Saharan Africa (IDA & IBRD countries)SudanSurinameSwazilandSwedenSwitzerlandSyrian Arab RepublicTajikistanTanzaniaThailandTimor-LesteTogoTongaTrinidad and TobagoTunisiaTurkeyTuvaluUgandaUkraineUnited KingdomUnited StatesUpper middle incomeUruguayVanuatuVenezuela, RBVietnamWest Bank and GazaWorldYemen, Rep.ZambiaZimbabwe Timeline:
This timeline shows a graph from 1983 to 2016 of IBRD only. No data until 1982. Number of actual observations by date: 34.
Source name:
World Development Indicators
Source organization:
International Monetary Fund, Balance of Payments Statistics Yearbook and data files.
Categories, topics:
Economy & Growth, External Debt, Trade
Last updated:
apr 23, 2017
Indicators value changes by year
Minimum:
430.856 bln
jan 1, 1987
Maximum:
7.776 trl
jan 1, 2015
At the date of observation
Value
Absolute change
Change from previous value
jan 1, 1983
483.45 bln
+483.45 bln
0.0%
jan 1, 1984
445.945 bln
-37.506 bln
-7.76%
jan 1, 1985
457.581 bln
+11.636 bln
2.61%
jan 1, 1986
448.004 bln
-9.577 bln
-2.09%
jan 1, 1987
430.856 bln
-17.148 bln
-3.83%
jan 1, 1988
467.632 bln
+36.776 bln
8.54%
jan 1, 1989
532.454 bln
+64.822 bln
13.86%
jan 1, 1990
589.328 bln
+56.874 bln
10.68%
jan 1, 1991
658.026 bln
+68.698 bln
11.66%
jan 1, 1992
707.476 bln
+49.45 bln
7.51%
jan 1, 1993
798.426 bln
+90.95 bln
12.86%
jan 1, 1994
889.717 bln
+91.291 bln
11.43%
jan 1, 1995
987.63 bln
+97.914 bln
11.01%
jan 1, 1996
1.202 trl
+214.797 bln
21.75%
jan 1, 1997
1.318 trl
+115.612 bln
9.61%
jan 1, 1998
1.353 trl
+34.57 bln
2.62%
jan 1, 1999
1.326 trl
-26.487 bln
-1.96%
jan 1, 2000
1.297 trl
-28.879 bln
-2.18%
jan 1, 2001
1.529 trl
+231.582 bln
17.85%
jan 1, 2002
1.525 trl
-3.68 bln
-0.24%
jan 1, 2003
1.57 trl
+44.407 bln
2.91%
jan 1, 2004
1.978 trl
+408.653 bln
26.04%
jan 1, 2005
2.511 trl
+533.079 bln
26.95%
jan 1, 2006
3.04 trl
+528.536 bln
21.05%
jan 1, 2007
3.629 trl
+588.901 bln
19.37%
jan 1, 2008
4.457 trl
+828.401 bln
22.83%
jan 1, 2009
5.474 trl
+1.017 trl
22.82%
jan 1, 2010
4.453 trl
-1.021 trl
-18.65%
jan 1, 2011
5.695 trl
+1.241 trl
27.88%
jan 1, 2012
7.059 trl
+1.365 trl
23.96%
jan 1, 2013
7.38 trl
+320.849 bln
4.55%
jan 1, 2014
7.748 trl
+367.827 bln
4.98%
jan 1, 2015
7.776 trl
+28.416 bln
0.37%
jan 1, 2016
6.825 trl
-950.921 bln
-12.23%
Ranking of countries by current statistics by years


Comments: