29
/
en
AIzaSyAYiBZKx7MnpbEhh9jyipgxe19OcubqV5w
April 1, 2024
64845
Albania
ALB
true
2
1
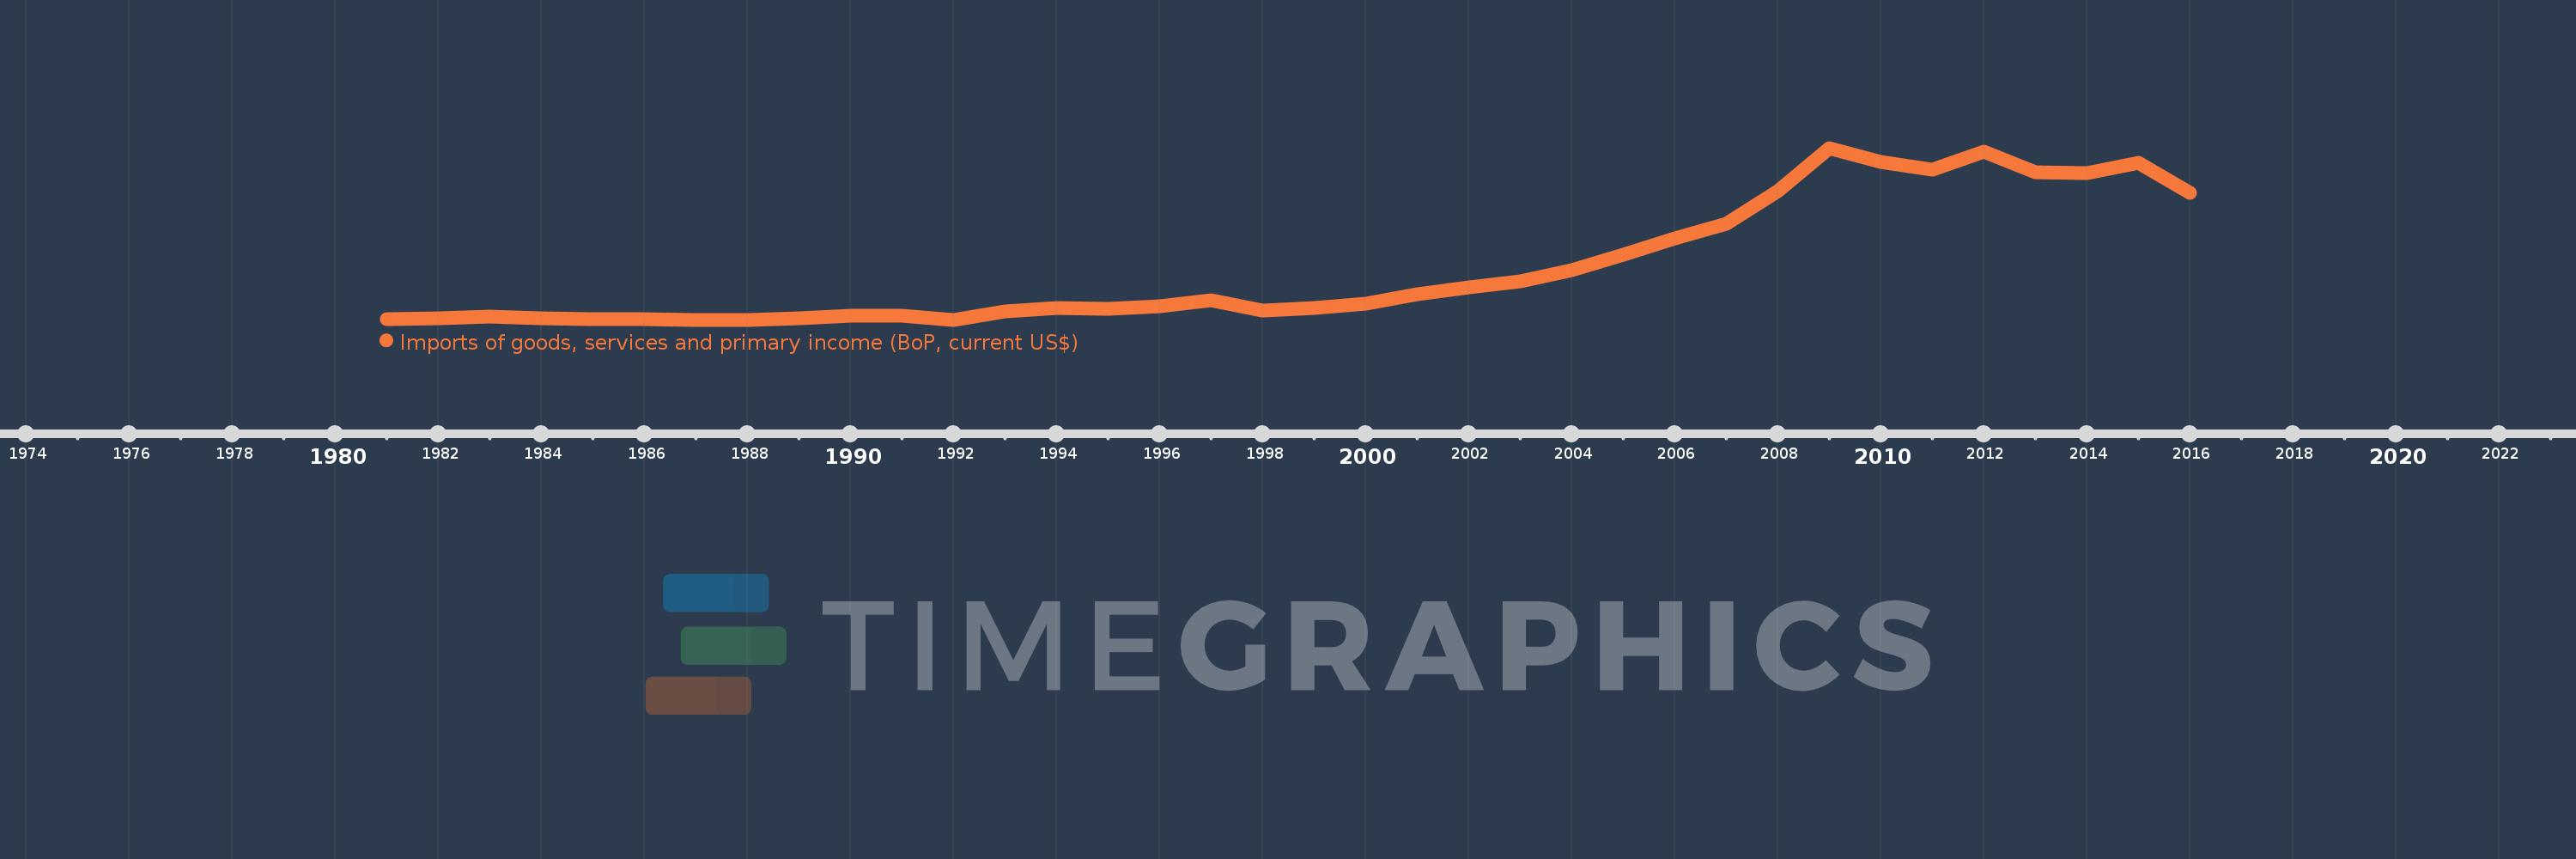
Imports of goods, services and primary income (BoP, current US$)
2016,2015,2014,2013,2012,2011,2010,2009,2008,2007,2006,2005,2004,2003,2002,2001,2000,1999,1998,1997,1996,1995,1994,1993,1992,1991,1990,1989,1988,1987,1986,1985,1984,1983,1982,1981
This statistics in other country:
AfghanistanAlbaniaAlgeriaAngolaAntigua and BarbudaArab WorldArgentinaArmeniaArubaAustraliaAustriaAzerbaijanBahamas, TheBahrainBangladeshBarbadosBelarusBelgiumBelizeBeninBermudaBhutanBoliviaBosnia and HerzegovinaBotswanaBrazilBrunei DarussalamBulgariaBurkina FasoBurundiCabo VerdeCambodiaCameroonCanadaCaribbean small statesCentral African RepublicCentral Europe and the BalticsChadChileChinaColombiaComorosCongo, Dem. Rep.Congo, Rep.Costa RicaCote d'IvoireCroatiaCuracaoCyprusCzech RepublicDenmarkDjiboutiDominicaDominican RepublicEarly-demographic dividendEast Asia & PacificEast Asia & Pacific (excluding high income)East Asia & Pacific (IDA & IBRD countries)EcuadorEgypt, Arab Rep.El SalvadorEquatorial GuineaEritreaEstoniaEthiopiaEuro areaEurope & Central AsiaEurope & Central Asia (excluding high income)Europe & Central Asia (IDA & IBRD countries)European UnionFaroe IslandsFijiFinlandFragile and conflict affected situationsFranceFrench PolynesiaGabonGambia, TheGeorgiaGermanyGhanaGreeceGrenadaGuatemalaGuineaGuinea-BissauGuyanaHaitiHeavily indebted poor countries (HIPC)High incomeHondurasHong Kong SAR, ChinaHungaryIBRD onlyIcelandIDA & IBRD totalIDA blendIDA onlyIDA totalIndiaIndonesiaIran, Islamic Rep.IraqIrelandIsraelItalyJamaicaJapanJordanKazakhstanKenyaKiribatiKorea, Rep.KosovoKuwaitKyrgyz RepublicLao PDRLate-demographic dividendLatin America & Caribbean Latin America & Caribbean (excluding high income)Latin America & the Caribbean (IDA & IBRD countries)LatviaLeast developed countries: UN classificationLebanonLesothoLiberiaLibyaLithuaniaLow & middle incomeLow incomeLower middle incomeLuxembourgMacao SAR, ChinaMacedonia, FYRMadagascarMalawiMalaysiaMaldivesMaliMaltaMarshall IslandsMauritaniaMauritiusMexicoMicronesia, Fed. Sts.Middle East & North Africa (excluding high income)Middle East & North Africa (IDA & IBRD countries)Middle incomeMoldovaMongoliaMontenegroMoroccoMozambiqueMyanmarNamibiaNepalNetherlandsNew CaledoniaNicaraguaNigerNigeriaNorth AmericaNorwayOECD membersOmanOther small statesPacific island small statesPakistanPalauPanamaPapua New GuineaParaguayPeruPhilippinesPolandPortugalPost-demographic dividendPre-demographic dividendQatarRomaniaRussian FederationRwandaSamoaSao Tome and PrincipeSaudi ArabiaSenegalSerbiaSeychellesSierra LeoneSingaporeSint Maarten (Dutch part)Slovak RepublicSloveniaSmall statesSolomon IslandsSouth AfricaSouth AsiaSouth Asia (IDA & IBRD)South SudanSpainSri LankaSt. Kitts and NevisSt. LuciaSt. Vincent and the GrenadinesSub-Saharan Africa Sub-Saharan Africa (excluding high income)Sub-Saharan Africa (IDA & IBRD countries)SudanSurinameSwazilandSwedenSwitzerlandSyrian Arab RepublicTajikistanTanzaniaThailandTimor-LesteTogoTongaTrinidad and TobagoTunisiaTurkeyTuvaluUgandaUkraineUnited KingdomUnited StatesUpper middle incomeUruguayVanuatuVenezuela, RBVietnamWest Bank and GazaWorldYemen, Rep.ZambiaZimbabwe Timeline:
This timeline shows a graph from 1981 to 2016 of Albania. No data until 1980. Number of actual observations by date: 36.
Source name:
World Development Indicators
Source organization:
International Monetary Fund, Balance of Payments Statistics Yearbook and data files.
Categories, topics:
Economy & Growth, External Debt, Trade
Last updated:
apr 23, 2017
Indicators value changes by year
Minimum:
336.3 mln
jan 1, 1988
Maximum:
7.149 bln
jan 1, 2009
At the date of observation
Value
Absolute change
Change from previous value
jan 1, 1981
375.3 mln
+375.3 mln
0.0%
jan 1, 1982
404.1 mln
+28.8 mln
7.67%
jan 1, 1983
461.1 mln
+57.0 mln
14.11%
jan 1, 1984
406.0 mln
-55.1 mln
-11.95%
jan 1, 1985
373.4 mln
-32.6 mln
-8.03%
jan 1, 1986
362.9 mln
-10.5 mln
-2.81%
jan 1, 1987
337.0 mln
-25.9 mln
-7.14%
jan 1, 1988
336.3 mln
-700.0K
-0.21%
jan 1, 1989
409.2 mln
+72.9 mln
21.68%
jan 1, 1990
484.2 mln
+75.0 mln
18.33%
jan 1, 1991
486.9 mln
+2.7 mln
0.56%
jan 1, 1992
340.3 mln
-146.6 mln
-30.11%
jan 1, 1993
667.3 mln
+327.0 mln
96.09%
jan 1, 1994
794.4 mln
+127.1 mln
19.05%
jan 1, 1995
774.8 mln
-19.6 mln
-2.47%
jan 1, 1996
864.6 mln
+89.8 mln
11.59%
jan 1, 1997
1.123 bln
+258.7 mln
29.92%
jan 1, 1998
697.612 mln
-425.688 mln
-37.9%
jan 1, 1999
792.18 mln
+94.567 mln
13.56%
jan 1, 2000
956.4 mln
+164.22 mln
20.73%
jan 1, 2001
1.36 bln
+403.2 mln
42.16%
jan 1, 2002
1.609 bln
+249.0 mln
18.31%
jan 1, 2003
1.848 bln
+239.49 mln
14.89%
jan 1, 2004
2.29 bln
+442.206 mln
23.93%
jan 1, 2005
2.921 bln
+630.773 mln
27.54%
jan 1, 2006
3.553 bln
+631.892 mln
21.63%
jan 1, 2007
4.142 bln
+589.254 mln
16.58%
jan 1, 2008
5.429 bln
+1.287 bln
31.07%
jan 1, 2009
7.149 bln
+1.72 bln
31.68%
jan 1, 2010
6.598 bln
-550.942 mln
-7.71%
jan 1, 2011
6.28 bln
-318.434 mln
-4.83%
jan 1, 2012
7.01 bln
+730.371 mln
11.63%
jan 1, 2013
6.189 bln
-821.121 mln
-11.71%
jan 1, 2014
6.158 bln
-30.739 mln
-0.5%
jan 1, 2015
6.562 bln
+404.145 mln
6.56%
jan 1, 2016
5.351 bln
-1.211 bln
-18.46%
Ranking of countries by current statistics by years


Comments: