29
/
en
AIzaSyAYiBZKx7MnpbEhh9jyipgxe19OcubqV5w
April 1, 2024
235905
Senegal
SEN
true
2
1
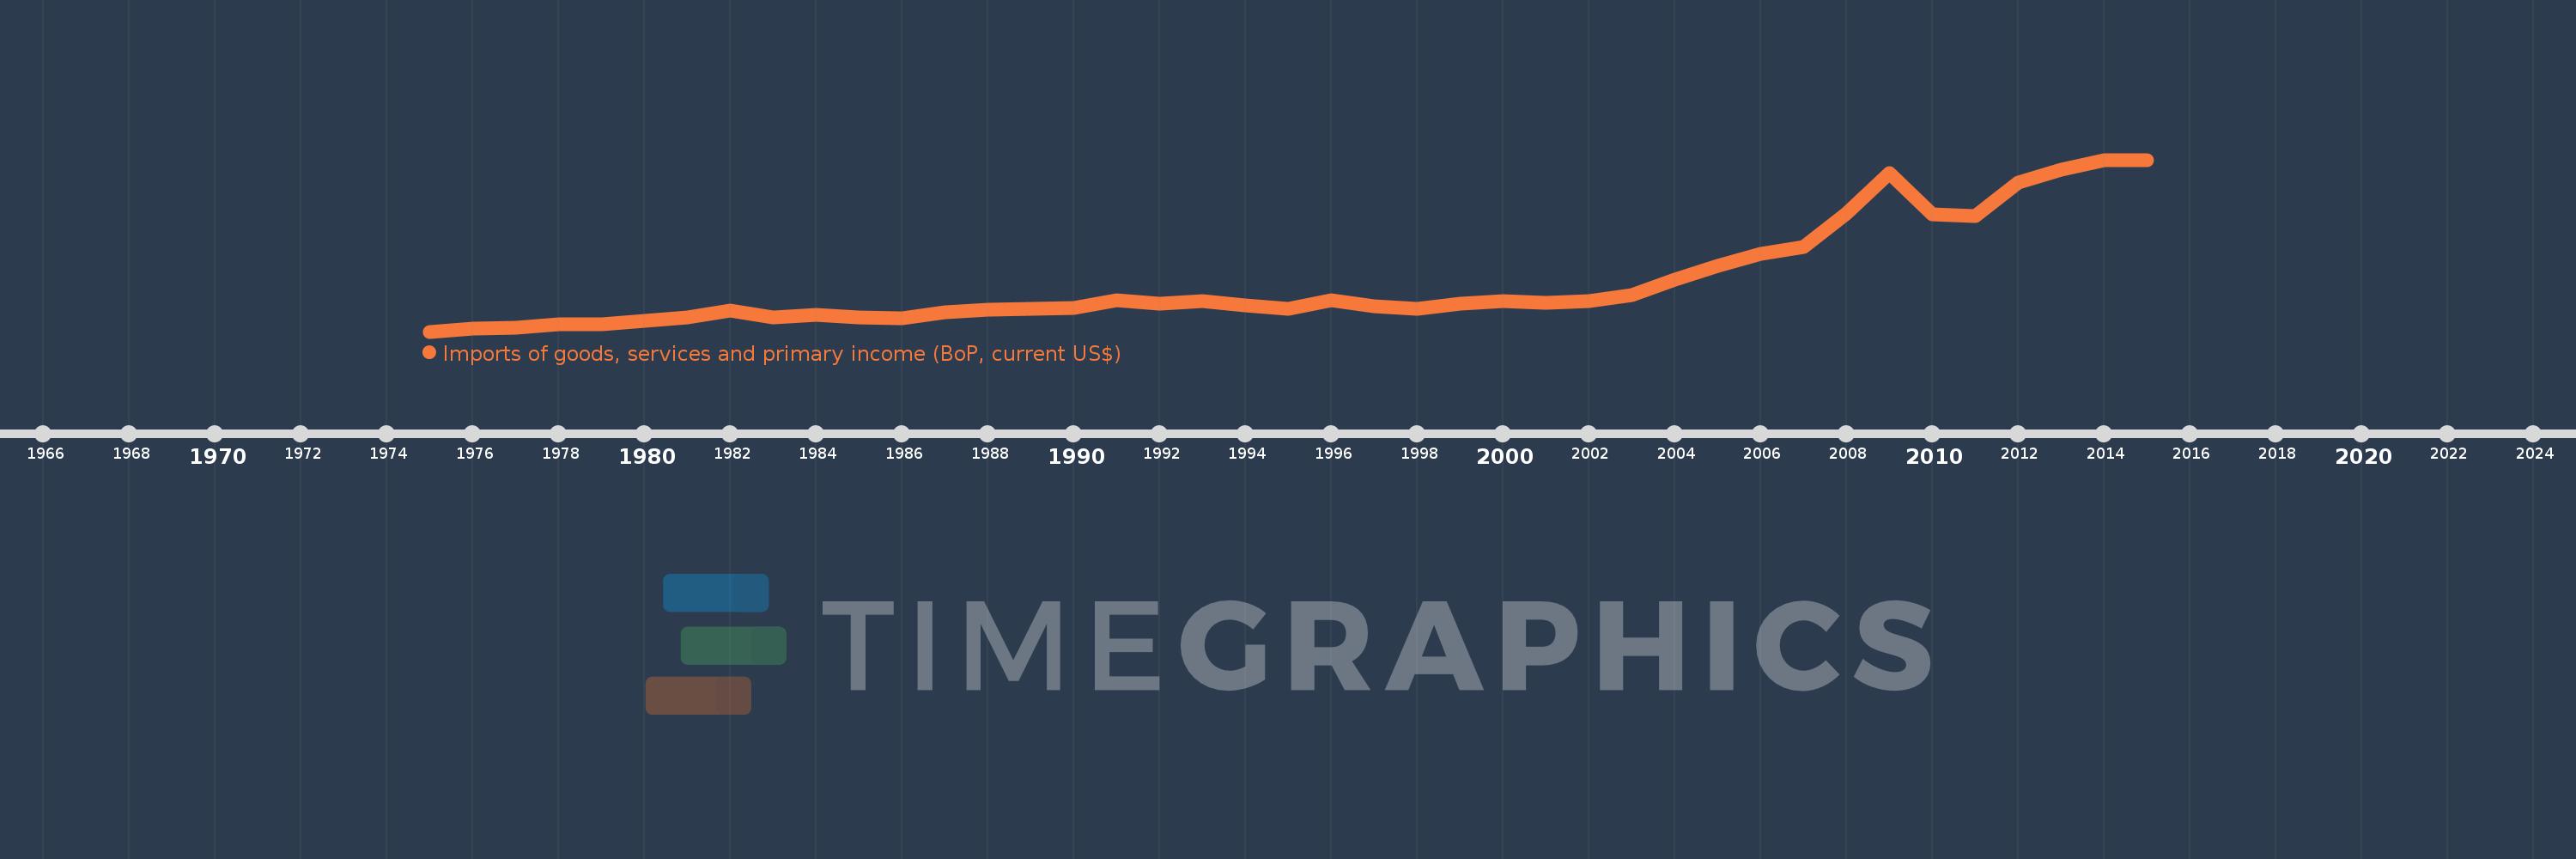
Imports of goods, services and primary income (BoP, current US$)
2015,2014,2013,2012,2011,2010,2009,2008,2007,2006,2005,2004,2003,2002,2001,2000,1999,1998,1997,1996,1995,1994,1993,1992,1991,1990,1989,1988,1987,1986,1985,1984,1983,1982,1981,1980,1979,1978,1977,1976,1975
This statistics in other country:
AfghanistanAlbaniaAlgeriaAngolaAntigua and BarbudaArab WorldArgentinaArmeniaArubaAustraliaAustriaAzerbaijanBahamas, TheBahrainBangladeshBarbadosBelarusBelgiumBelizeBeninBermudaBhutanBoliviaBosnia and HerzegovinaBotswanaBrazilBrunei DarussalamBulgariaBurkina FasoBurundiCabo VerdeCambodiaCameroonCanadaCaribbean small statesCentral African RepublicCentral Europe and the BalticsChadChileChinaColombiaComorosCongo, Dem. Rep.Congo, Rep.Costa RicaCote d'IvoireCroatiaCuracaoCyprusCzech RepublicDenmarkDjiboutiDominicaDominican RepublicEarly-demographic dividendEast Asia & PacificEast Asia & Pacific (excluding high income)East Asia & Pacific (IDA & IBRD countries)EcuadorEgypt, Arab Rep.El SalvadorEquatorial GuineaEritreaEstoniaEthiopiaEuro areaEurope & Central AsiaEurope & Central Asia (excluding high income)Europe & Central Asia (IDA & IBRD countries)European UnionFaroe IslandsFijiFinlandFragile and conflict affected situationsFranceFrench PolynesiaGabonGambia, TheGeorgiaGermanyGhanaGreeceGrenadaGuatemalaGuineaGuinea-BissauGuyanaHaitiHeavily indebted poor countries (HIPC)High incomeHondurasHong Kong SAR, ChinaHungaryIBRD onlyIcelandIDA & IBRD totalIDA blendIDA onlyIDA totalIndiaIndonesiaIran, Islamic Rep.IraqIrelandIsraelItalyJamaicaJapanJordanKazakhstanKenyaKiribatiKorea, Rep.KosovoKuwaitKyrgyz RepublicLao PDRLate-demographic dividendLatin America & Caribbean Latin America & Caribbean (excluding high income)Latin America & the Caribbean (IDA & IBRD countries)LatviaLeast developed countries: UN classificationLebanonLesothoLiberiaLibyaLithuaniaLow & middle incomeLow incomeLower middle incomeLuxembourgMacao SAR, ChinaMacedonia, FYRMadagascarMalawiMalaysiaMaldivesMaliMaltaMarshall IslandsMauritaniaMauritiusMexicoMicronesia, Fed. Sts.Middle East & North Africa (excluding high income)Middle East & North Africa (IDA & IBRD countries)Middle incomeMoldovaMongoliaMontenegroMoroccoMozambiqueMyanmarNamibiaNepalNetherlandsNew CaledoniaNicaraguaNigerNigeriaNorth AmericaNorwayOECD membersOmanOther small statesPacific island small statesPakistanPalauPanamaPapua New GuineaParaguayPeruPhilippinesPolandPortugalPost-demographic dividendPre-demographic dividendQatarRomaniaRussian FederationRwandaSamoaSao Tome and PrincipeSaudi ArabiaSenegalSerbiaSeychellesSierra LeoneSingaporeSint Maarten (Dutch part)Slovak RepublicSloveniaSmall statesSolomon IslandsSouth AfricaSouth AsiaSouth Asia (IDA & IBRD)South SudanSpainSri LankaSt. Kitts and NevisSt. LuciaSt. Vincent and the GrenadinesSub-Saharan Africa Sub-Saharan Africa (excluding high income)Sub-Saharan Africa (IDA & IBRD countries)SudanSurinameSwazilandSwedenSwitzerlandSyrian Arab RepublicTajikistanTanzaniaThailandTimor-LesteTogoTongaTrinidad and TobagoTunisiaTurkeyTuvaluUgandaUkraineUnited KingdomUnited StatesUpper middle incomeUruguayVanuatuVenezuela, RBVietnamWest Bank and GazaWorldYemen, Rep.ZambiaZimbabwe Timeline:
This timeline shows a graph from 1975 to 2015 of Senegal. No data until 1974. Number of actual observations by date: 41.
Source name:
World Development Indicators
Source organization:
International Monetary Fund, Balance of Payments Statistics Yearbook and data files.
Categories, topics:
Economy & Growth, External Debt, Trade
Last updated:
apr 23, 2017
Indicators value changes by year
Minimum:
737.709 mln
jan 1, 1975
Maximum:
7.907 bln
jan 1, 2014
At the date of observation
Value
Absolute change
Change from previous value
jan 1, 1975
737.709 mln
+737.709 mln
0.0%
jan 1, 1976
865.743 mln
+128.034 mln
17.36%
jan 1, 1977
902.823 mln
+37.079 mln
4.28%
jan 1, 1978
1.039 bln
+136.376 mln
15.11%
jan 1, 1979
1.043 bln
+3.407 mln
0.33%
jan 1, 1980
1.197 bln
+154.264 mln
14.8%
jan 1, 1981
1.337 bln
+140.127 mln
11.71%
jan 1, 1982
1.631 bln
+293.805 mln
21.97%
jan 1, 1983
1.347 bln
-284.083 mln
-17.42%
jan 1, 1984
1.433 bln
+86.367 mln
6.41%
jan 1, 1985
1.327 bln
-105.882 mln
-7.39%
jan 1, 1986
1.296 bln
-30.79 mln
-2.32%
jan 1, 1987
1.542 bln
+245.231 mln
18.92%
jan 1, 1988
1.665 bln
+123.047 mln
7.98%
jan 1, 1989
1.698 bln
+32.954 mln
1.98%
jan 1, 1990
1.738 bln
+40.368 mln
2.38%
jan 1, 1991
2.053 bln
+315.174 mln
18.13%
jan 1, 1992
1.913 bln
-140.648 mln
-6.85%
jan 1, 1993
2.019 bln
+106.452 mln
5.57%
jan 1, 1994
1.83 bln
-188.698 mln
-9.35%
jan 1, 1995
1.679 bln
-151.109 mln
-8.26%
jan 1, 1996
2.033 bln
+353.441 mln
21.05%
jan 1, 1997
1.81 bln
-222.624 mln
-10.95%
jan 1, 1998
1.703 bln
-107.326 mln
-5.93%
jan 1, 1999
1.888 bln
+184.993 mln
10.86%
jan 1, 2000
2.001 bln
+113.717 mln
6.02%
jan 1, 2001
1.938 bln
-63.631 mln
-3.18%
jan 1, 2002
2.013 bln
+75.098 mln
3.88%
jan 1, 2003
2.274 bln
+260.756 mln
12.95%
jan 1, 2004
2.907 bln
+633.245 mln
27.85%
jan 1, 2005
3.478 bln
+571.062 mln
19.65%
jan 1, 2006
3.991 bln
+513.378 mln
14.76%
jan 1, 2007
4.274 bln
+282.645 mln
7.08%
jan 1, 2008
5.676 bln
+1.402 bln
32.8%
jan 1, 2009
7.353 bln
+1.677 bln
29.55%
jan 1, 2010
5.613 bln
-1.74 bln
-23.66%
jan 1, 2011
5.557 bln
-56.122 mln
-1.0%
jan 1, 2012
6.969 bln
+1.413 bln
25.42%
jan 1, 2013
7.496 bln
+526.675 mln
7.56%
jan 1, 2014
7.907 bln
+410.599 mln
5.48%
jan 1, 2015
7.9 bln
-6.138 mln
-0.08%
Ranking of countries by current statistics by years


Comments: