29
/
en
AIzaSyAYiBZKx7MnpbEhh9jyipgxe19OcubqV5w
April 1, 2024
54129
Pacific island small states
PSS
false
2
1
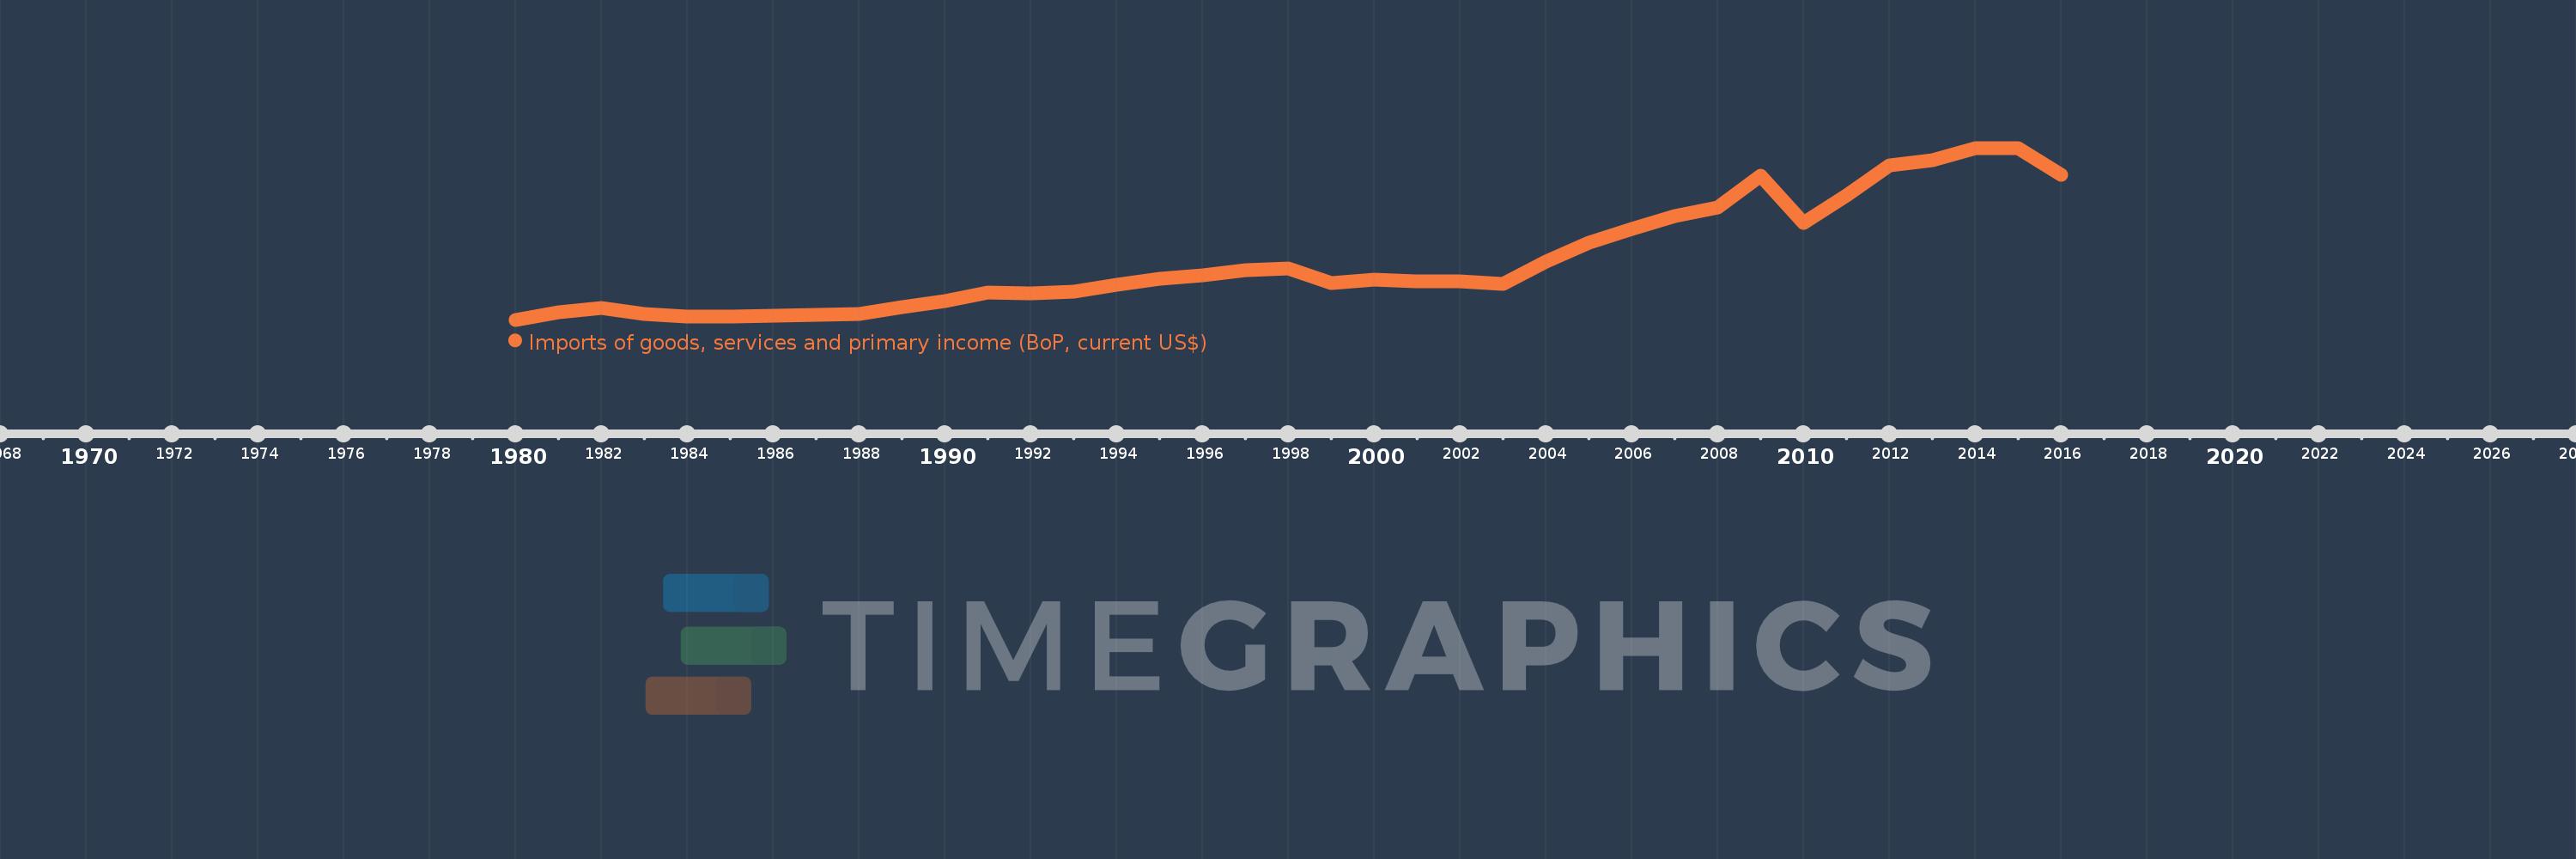
Imports of goods, services and primary income (BoP, current US$)
2016,2015,2014,2013,2012,2011,2010,2009,2008,2007,2006,2005,2004,2003,2002,2001,2000,1999,1998,1997,1996,1995,1994,1993,1992,1991,1990,1989,1988,1987,1986,1985,1984,1983,1982,1981,1980
This statistics in other country:
AfghanistanAlbaniaAlgeriaAngolaAntigua and BarbudaArab WorldArgentinaArmeniaArubaAustraliaAustriaAzerbaijanBahamas, TheBahrainBangladeshBarbadosBelarusBelgiumBelizeBeninBermudaBhutanBoliviaBosnia and HerzegovinaBotswanaBrazilBrunei DarussalamBulgariaBurkina FasoBurundiCabo VerdeCambodiaCameroonCanadaCaribbean small statesCentral African RepublicCentral Europe and the BalticsChadChileChinaColombiaComorosCongo, Dem. Rep.Congo, Rep.Costa RicaCote d'IvoireCroatiaCuracaoCyprusCzech RepublicDenmarkDjiboutiDominicaDominican RepublicEarly-demographic dividendEast Asia & PacificEast Asia & Pacific (excluding high income)East Asia & Pacific (IDA & IBRD countries)EcuadorEgypt, Arab Rep.El SalvadorEquatorial GuineaEritreaEstoniaEthiopiaEuro areaEurope & Central AsiaEurope & Central Asia (excluding high income)Europe & Central Asia (IDA & IBRD countries)European UnionFaroe IslandsFijiFinlandFragile and conflict affected situationsFranceFrench PolynesiaGabonGambia, TheGeorgiaGermanyGhanaGreeceGrenadaGuatemalaGuineaGuinea-BissauGuyanaHaitiHeavily indebted poor countries (HIPC)High incomeHondurasHong Kong SAR, ChinaHungaryIBRD onlyIcelandIDA & IBRD totalIDA blendIDA onlyIDA totalIndiaIndonesiaIran, Islamic Rep.IraqIrelandIsraelItalyJamaicaJapanJordanKazakhstanKenyaKiribatiKorea, Rep.KosovoKuwaitKyrgyz RepublicLao PDRLate-demographic dividendLatin America & Caribbean Latin America & Caribbean (excluding high income)Latin America & the Caribbean (IDA & IBRD countries)LatviaLeast developed countries: UN classificationLebanonLesothoLiberiaLibyaLithuaniaLow & middle incomeLow incomeLower middle incomeLuxembourgMacao SAR, ChinaMacedonia, FYRMadagascarMalawiMalaysiaMaldivesMaliMaltaMarshall IslandsMauritaniaMauritiusMexicoMicronesia, Fed. Sts.Middle East & North Africa (excluding high income)Middle East & North Africa (IDA & IBRD countries)Middle incomeMoldovaMongoliaMontenegroMoroccoMozambiqueMyanmarNamibiaNepalNetherlandsNew CaledoniaNicaraguaNigerNigeriaNorth AmericaNorwayOECD membersOmanOther small statesPacific island small statesPakistanPalauPanamaPapua New GuineaParaguayPeruPhilippinesPolandPortugalPost-demographic dividendPre-demographic dividendQatarRomaniaRussian FederationRwandaSamoaSao Tome and PrincipeSaudi ArabiaSenegalSerbiaSeychellesSierra LeoneSingaporeSint Maarten (Dutch part)Slovak RepublicSloveniaSmall statesSolomon IslandsSouth AfricaSouth AsiaSouth Asia (IDA & IBRD)South SudanSpainSri LankaSt. Kitts and NevisSt. LuciaSt. Vincent and the GrenadinesSub-Saharan Africa Sub-Saharan Africa (excluding high income)Sub-Saharan Africa (IDA & IBRD countries)SudanSurinameSwazilandSwedenSwitzerlandSyrian Arab RepublicTajikistanTanzaniaThailandTimor-LesteTogoTongaTrinidad and TobagoTunisiaTurkeyTuvaluUgandaUkraineUnited KingdomUnited StatesUpper middle incomeUruguayVanuatuVenezuela, RBVietnamWest Bank and GazaWorldYemen, Rep.ZambiaZimbabwe Timeline:
This timeline shows a graph from 1980 to 2016 of Pacific island small states. No data until 1979. Number of actual observations by date: 37.
Source name:
World Development Indicators
Source organization:
International Monetary Fund, Balance of Payments Statistics Yearbook and data files.
Categories, topics:
Economy & Growth, External Debt, Trade
Last updated:
apr 23, 2017
Indicators value changes by year
Minimum:
1.025 bln
jan 1, 1980
Maximum:
6.103 bln
jan 1, 2015
At the date of observation
Value
Absolute change
Change from previous value
jan 1, 1980
1.025 bln
+1.025 bln
0.0%
jan 1, 1981
1.234 bln
+208.979 mln
20.38%
jan 1, 1982
1.371 bln
+136.857 mln
11.09%
jan 1, 1983
1.204 bln
-166.893 mln
-12.17%
jan 1, 1984
1.129 bln
-75.334 mln
-6.25%
jan 1, 1985
1.129 bln
+264.054K
0.02%
jan 1, 1986
1.137 bln
+7.234 mln
0.64%
jan 1, 1987
1.173 bln
+36.387 mln
3.2%
jan 1, 1988
1.183 bln
+10.424 mln
0.89%
jan 1, 1989
1.388 bln
+204.718 mln
17.3%
jan 1, 1990
1.566 bln
+177.605 mln
12.79%
jan 1, 1991
1.83 bln
+264.188 mln
16.87%
jan 1, 1992
1.817 bln
-12.397 mln
-0.68%
jan 1, 1993
1.846 bln
+28.919 mln
1.59%
jan 1, 1994
2.051 bln
+204.208 mln
11.06%
jan 1, 1995
2.247 bln
+196.318 mln
9.57%
jan 1, 1996
2.349 bln
+102.544 mln
4.56%
jan 1, 1997
2.487 bln
+137.406 mln
5.85%
jan 1, 1998
2.552 bln
+64.791 mln
2.61%
jan 1, 1999
2.104 bln
-447.994 mln
-17.56%
jan 1, 2000
2.208 bln
+103.825 mln
4.94%
jan 1, 2001
2.152 bln
-55.643 mln
-2.52%
jan 1, 2002
2.154 bln
+2.223 mln
0.1%
jan 1, 2003
2.093 bln
-61.518 mln
-2.86%
jan 1, 2004
2.747 bln
+654.403 mln
31.27%
jan 1, 2005
3.305 bln
+558.466 mln
20.33%
jan 1, 2006
3.714 bln
+408.755 mln
12.37%
jan 1, 2007
4.087 bln
+373.195 mln
10.05%
jan 1, 2008
4.336 bln
+248.149 mln
6.07%
jan 1, 2009
5.277 bln
+941.715 mln
21.72%
jan 1, 2010
3.898 bln
-1.379 bln
-26.13%
jan 1, 2011
4.702 bln
+803.596 mln
20.62%
jan 1, 2012
5.576 bln
+874.747 mln
18.61%
jan 1, 2013
5.751 bln
+174.339 mln
3.13%
jan 1, 2014
6.09 bln
+339.615 mln
5.91%
jan 1, 2015
6.103 bln
+12.438 mln
0.2%
jan 1, 2016
5.308 bln
-794.958 mln
-13.03%
Ranking of countries by current statistics by years


Comments: