29
/
en
AIzaSyAYiBZKx7MnpbEhh9jyipgxe19OcubqV5w
April 1, 2024
265879
Tonga
TON
true
2
1
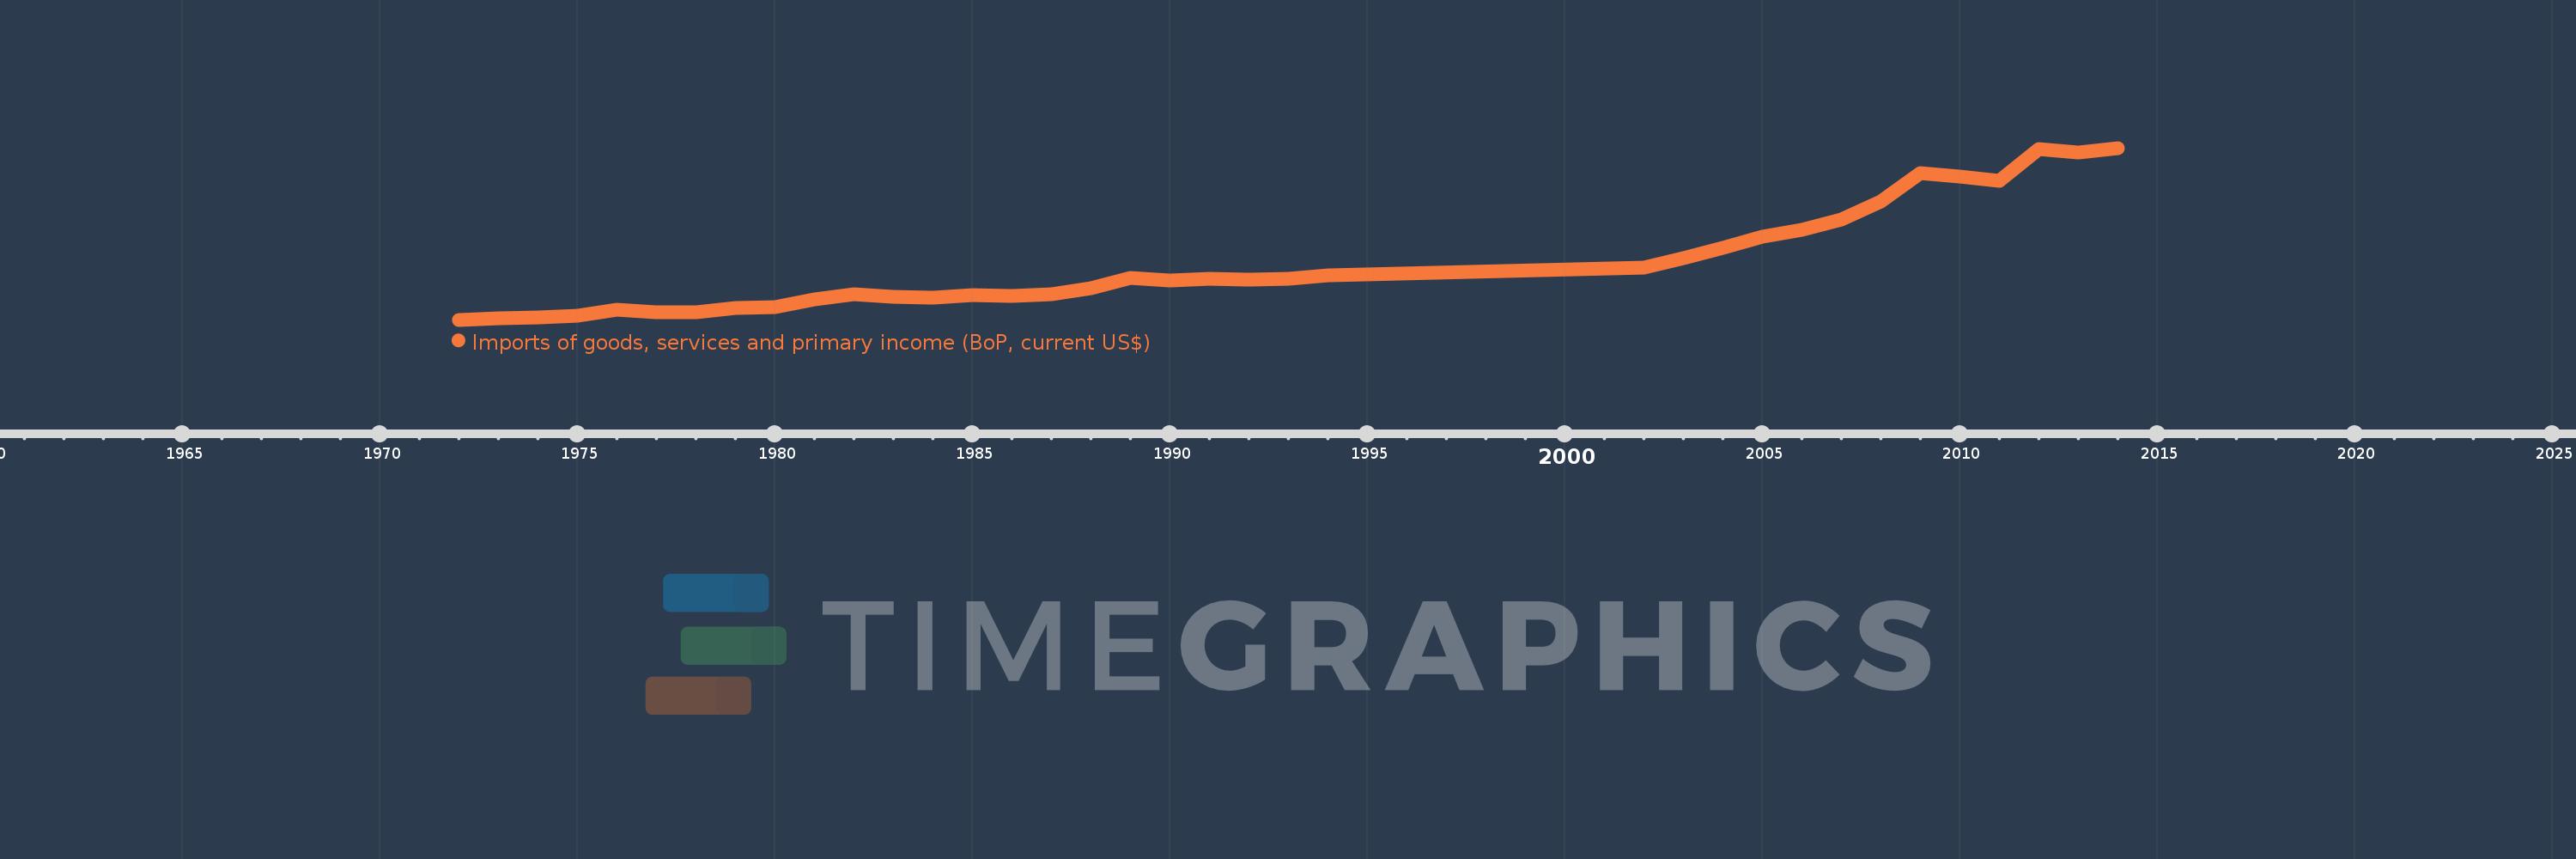
Imports of goods, services and primary income (BoP, current US$)
2014,2013,2012,2011,2010,2009,2008,2007,2006,2005,2004,2003,2002,1994,1993,1992,1991,1990,1989,1988,1987,1986,1985,1984,1983,1982,1981,1980,1979,1978,1977,1976,1975,1974,1973,1972
This statistics in other country:
AfghanistanAlbaniaAlgeriaAngolaAntigua and BarbudaArab WorldArgentinaArmeniaArubaAustraliaAustriaAzerbaijanBahamas, TheBahrainBangladeshBarbadosBelarusBelgiumBelizeBeninBermudaBhutanBoliviaBosnia and HerzegovinaBotswanaBrazilBrunei DarussalamBulgariaBurkina FasoBurundiCabo VerdeCambodiaCameroonCanadaCaribbean small statesCentral African RepublicCentral Europe and the BalticsChadChileChinaColombiaComorosCongo, Dem. Rep.Congo, Rep.Costa RicaCote d'IvoireCroatiaCuracaoCyprusCzech RepublicDenmarkDjiboutiDominicaDominican RepublicEarly-demographic dividendEast Asia & PacificEast Asia & Pacific (excluding high income)East Asia & Pacific (IDA & IBRD countries)EcuadorEgypt, Arab Rep.El SalvadorEquatorial GuineaEritreaEstoniaEthiopiaEuro areaEurope & Central AsiaEurope & Central Asia (excluding high income)Europe & Central Asia (IDA & IBRD countries)European UnionFaroe IslandsFijiFinlandFragile and conflict affected situationsFranceFrench PolynesiaGabonGambia, TheGeorgiaGermanyGhanaGreeceGrenadaGuatemalaGuineaGuinea-BissauGuyanaHaitiHeavily indebted poor countries (HIPC)High incomeHondurasHong Kong SAR, ChinaHungaryIBRD onlyIcelandIDA & IBRD totalIDA blendIDA onlyIDA totalIndiaIndonesiaIran, Islamic Rep.IraqIrelandIsraelItalyJamaicaJapanJordanKazakhstanKenyaKiribatiKorea, Rep.KosovoKuwaitKyrgyz RepublicLao PDRLate-demographic dividendLatin America & Caribbean Latin America & Caribbean (excluding high income)Latin America & the Caribbean (IDA & IBRD countries)LatviaLeast developed countries: UN classificationLebanonLesothoLiberiaLibyaLithuaniaLow & middle incomeLow incomeLower middle incomeLuxembourgMacao SAR, ChinaMacedonia, FYRMadagascarMalawiMalaysiaMaldivesMaliMaltaMarshall IslandsMauritaniaMauritiusMexicoMicronesia, Fed. Sts.Middle East & North Africa (excluding high income)Middle East & North Africa (IDA & IBRD countries)Middle incomeMoldovaMongoliaMontenegroMoroccoMozambiqueMyanmarNamibiaNepalNetherlandsNew CaledoniaNicaraguaNigerNigeriaNorth AmericaNorwayOECD membersOmanOther small statesPacific island small statesPakistanPalauPanamaPapua New GuineaParaguayPeruPhilippinesPolandPortugalPost-demographic dividendPre-demographic dividendQatarRomaniaRussian FederationRwandaSamoaSao Tome and PrincipeSaudi ArabiaSenegalSerbiaSeychellesSierra LeoneSingaporeSint Maarten (Dutch part)Slovak RepublicSloveniaSmall statesSolomon IslandsSouth AfricaSouth AsiaSouth Asia (IDA & IBRD)South SudanSpainSri LankaSt. Kitts and NevisSt. LuciaSt. Vincent and the GrenadinesSub-Saharan Africa Sub-Saharan Africa (excluding high income)Sub-Saharan Africa (IDA & IBRD countries)SudanSurinameSwazilandSwedenSwitzerlandSyrian Arab RepublicTajikistanTanzaniaThailandTimor-LesteTogoTongaTrinidad and TobagoTunisiaTurkeyTuvaluUgandaUkraineUnited KingdomUnited StatesUpper middle incomeUruguayVanuatuVenezuela, RBVietnamWest Bank and GazaWorldYemen, Rep.ZambiaZimbabwe Timeline:
This timeline shows a graph from 1972 to 2014 of Tonga. No data until 1971. Number of actual observations by date: 36.
Source name:
World Development Indicators
Source organization:
International Monetary Fund, Balance of Payments Statistics Yearbook and data files.
Categories, topics:
Economy & Growth, External Debt, Trade
Last updated:
apr 23, 2017
Indicators value changes by year
Minimum:
6.17 mln
jan 1, 1972
Maximum:
293.068 mln
jan 1, 2014
At the date of observation
Value
Absolute change
Change from previous value
jan 1, 1972
6.17 mln
+6.17 mln
0.0%
jan 1, 1973
8.254 mln
+2.085 mln
33.79%
jan 1, 1974
9.808 mln
+1.554 mln
18.82%
jan 1, 1975
12.872 mln
+3.064 mln
31.24%
jan 1, 1976
22.288 mln
+9.416 mln
73.15%
jan 1, 1977
18.842 mln
-3.446 mln
-15.46%
jan 1, 1978
18.844 mln
+2.03K
0.01%
jan 1, 1979
26.47 mln
+7.626 mln
40.47%
jan 1, 1980
27.852 mln
+1.382 mln
5.22%
jan 1, 1981
39.547 mln
+11.695 mln
41.99%
jan 1, 1982
48.127 mln
+8.58 mln
21.7%
jan 1, 1983
43.999 mln
-4.129 mln
-8.58%
jan 1, 1984
43.167 mln
-831.911K
-1.89%
jan 1, 1985
47.91 mln
+4.743 mln
10.99%
jan 1, 1986
46.495 mln
-1.414 mln
-2.95%
jan 1, 1987
49.325 mln
+2.829 mln
6.09%
jan 1, 1988
58.86 mln
+9.535 mln
19.33%
jan 1, 1989
75.597 mln
+16.737 mln
28.43%
jan 1, 1990
71.937 mln
-3.66 mln
-4.84%
jan 1, 1991
75.032 mln
+3.095 mln
4.3%
jan 1, 1992
72.953 mln
-2.079 mln
-2.77%
jan 1, 1993
74.755 mln
+1.802 mln
2.47%
jan 1, 1994
80.133 mln
+5.379 mln
7.2%
jan 1, 2002
93.51 mln
+13.377 mln
16.69%
jan 1, 2003
109.101 mln
+15.591 mln
16.67%
jan 1, 2004
125.804 mln
+16.703 mln
15.31%
jan 1, 2005
144.716 mln
+18.912 mln
15.03%
jan 1, 2006
156.805 mln
+12.09 mln
8.35%
jan 1, 2007
173.896 mln
+17.091 mln
10.9%
jan 1, 2008
203.169 mln
+29.273 mln
16.83%
jan 1, 2009
251.197 mln
+48.028 mln
23.64%
jan 1, 2010
245.422 mln
-5.776 mln
-2.3%
jan 1, 2011
238.281 mln
-7.141 mln
-2.91%
jan 1, 2012
291.348 mln
+53.068 mln
22.27%
jan 1, 2013
285.967 mln
-5.381 mln
-1.85%
jan 1, 2014
293.068 mln
+7.101 mln
2.48%
Ranking of countries by current statistics by years


Comments: