29
/
en
AIzaSyAYiBZKx7MnpbEhh9jyipgxe19OcubqV5w
April 1, 2024
122259
Dominican Republic
DOM
true
2
1
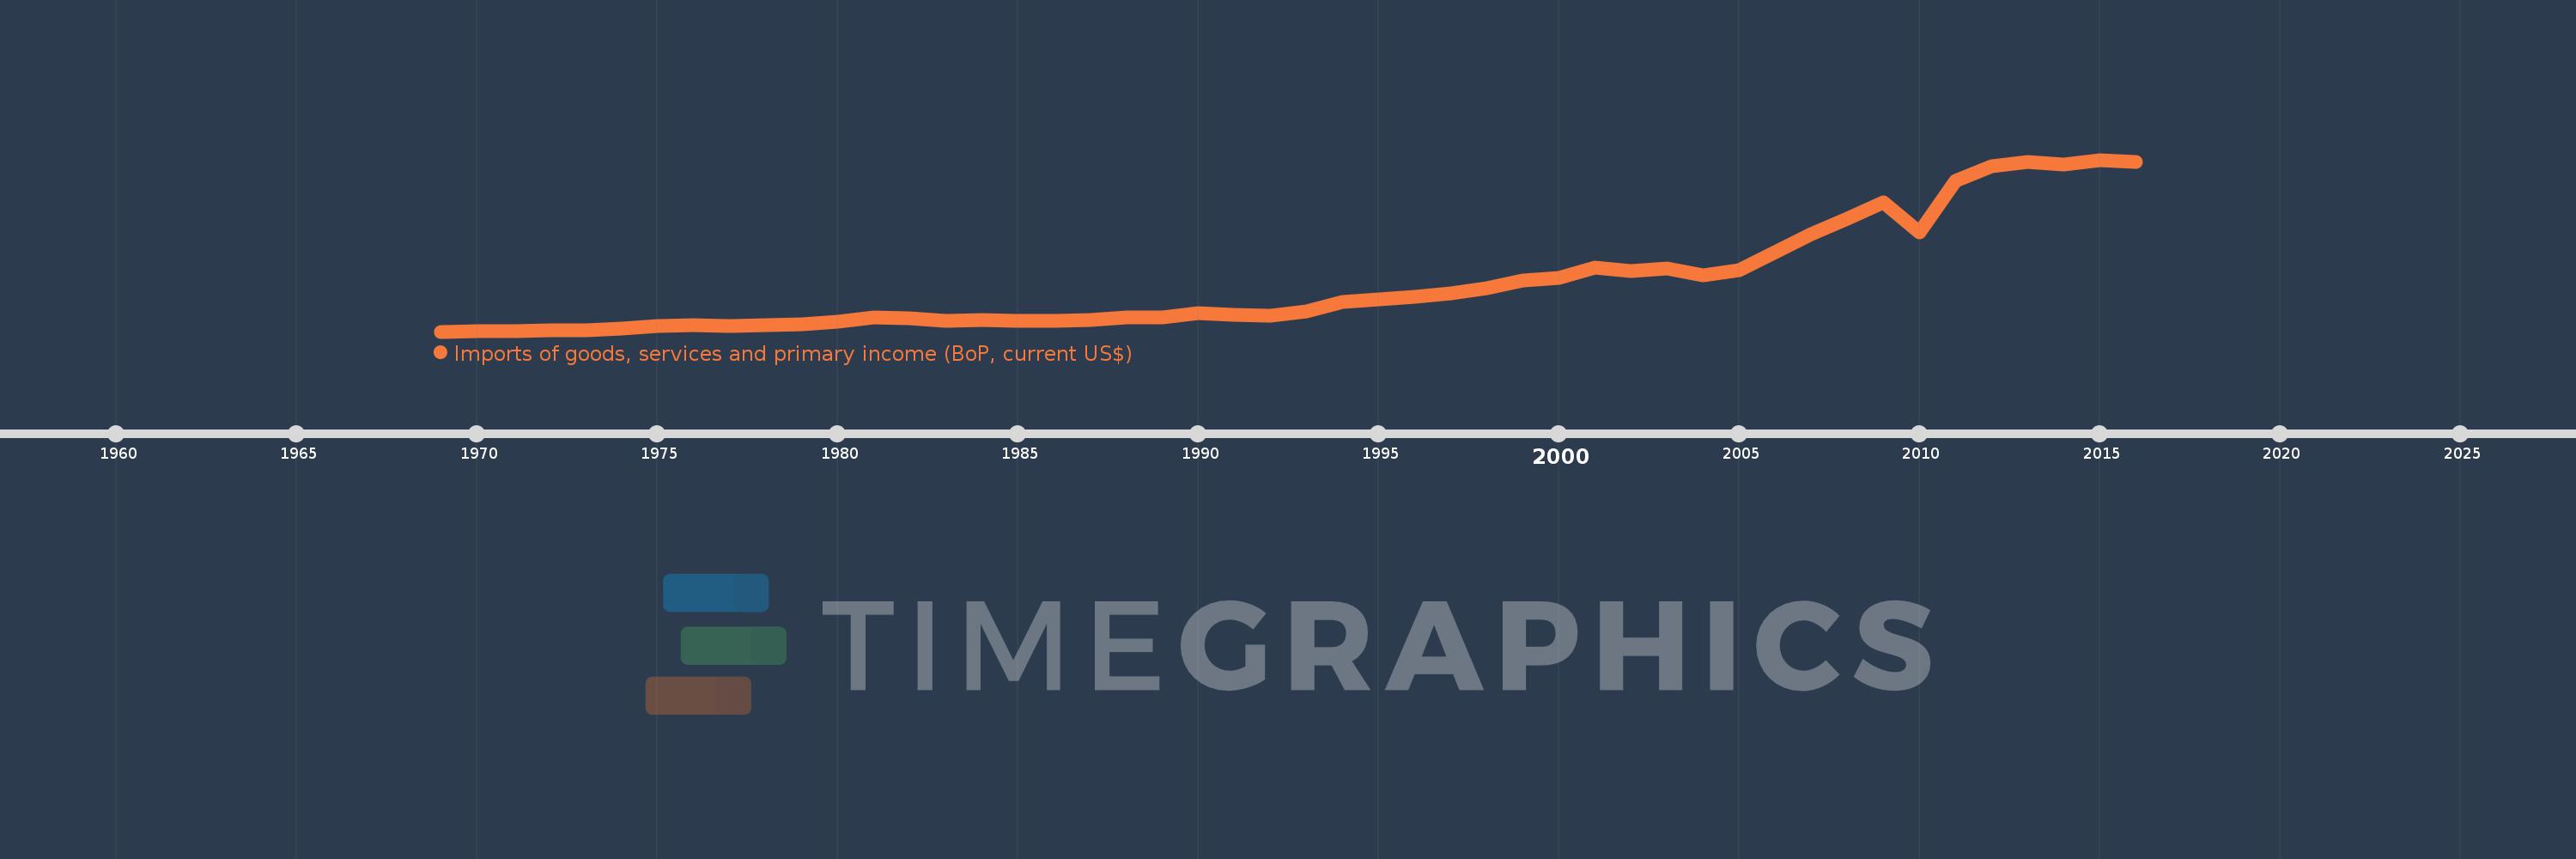
Imports of goods, services and primary income (BoP, current US$)
2016,2015,2014,2013,2012,2011,2010,2009,2008,2007,2006,2005,2004,2003,2002,2001,2000,1999,1998,1997,1996,1995,1994,1993,1992,1991,1990,1989,1988,1987,1986,1985,1984,1983,1982,1981,1980,1979,1978,1977,1976,1975,1974,1973,1972,1971,1970,1969
This statistics in other country:
AfghanistanAlbaniaAlgeriaAngolaAntigua and BarbudaArab WorldArgentinaArmeniaArubaAustraliaAustriaAzerbaijanBahamas, TheBahrainBangladeshBarbadosBelarusBelgiumBelizeBeninBermudaBhutanBoliviaBosnia and HerzegovinaBotswanaBrazilBrunei DarussalamBulgariaBurkina FasoBurundiCabo VerdeCambodiaCameroonCanadaCaribbean small statesCentral African RepublicCentral Europe and the BalticsChadChileChinaColombiaComorosCongo, Dem. Rep.Congo, Rep.Costa RicaCote d'IvoireCroatiaCuracaoCyprusCzech RepublicDenmarkDjiboutiDominicaDominican RepublicEarly-demographic dividendEast Asia & PacificEast Asia & Pacific (excluding high income)East Asia & Pacific (IDA & IBRD countries)EcuadorEgypt, Arab Rep.El SalvadorEquatorial GuineaEritreaEstoniaEthiopiaEuro areaEurope & Central AsiaEurope & Central Asia (excluding high income)Europe & Central Asia (IDA & IBRD countries)European UnionFaroe IslandsFijiFinlandFragile and conflict affected situationsFranceFrench PolynesiaGabonGambia, TheGeorgiaGermanyGhanaGreeceGrenadaGuatemalaGuineaGuinea-BissauGuyanaHaitiHeavily indebted poor countries (HIPC)High incomeHondurasHong Kong SAR, ChinaHungaryIBRD onlyIcelandIDA & IBRD totalIDA blendIDA onlyIDA totalIndiaIndonesiaIran, Islamic Rep.IraqIrelandIsraelItalyJamaicaJapanJordanKazakhstanKenyaKiribatiKorea, Rep.KosovoKuwaitKyrgyz RepublicLao PDRLate-demographic dividendLatin America & Caribbean Latin America & Caribbean (excluding high income)Latin America & the Caribbean (IDA & IBRD countries)LatviaLeast developed countries: UN classificationLebanonLesothoLiberiaLibyaLithuaniaLow & middle incomeLow incomeLower middle incomeLuxembourgMacao SAR, ChinaMacedonia, FYRMadagascarMalawiMalaysiaMaldivesMaliMaltaMarshall IslandsMauritaniaMauritiusMexicoMicronesia, Fed. Sts.Middle East & North Africa (excluding high income)Middle East & North Africa (IDA & IBRD countries)Middle incomeMoldovaMongoliaMontenegroMoroccoMozambiqueMyanmarNamibiaNepalNetherlandsNew CaledoniaNicaraguaNigerNigeriaNorth AmericaNorwayOECD membersOmanOther small statesPacific island small statesPakistanPalauPanamaPapua New GuineaParaguayPeruPhilippinesPolandPortugalPost-demographic dividendPre-demographic dividendQatarRomaniaRussian FederationRwandaSamoaSao Tome and PrincipeSaudi ArabiaSenegalSerbiaSeychellesSierra LeoneSingaporeSint Maarten (Dutch part)Slovak RepublicSloveniaSmall statesSolomon IslandsSouth AfricaSouth AsiaSouth Asia (IDA & IBRD)South SudanSpainSri LankaSt. Kitts and NevisSt. LuciaSt. Vincent and the GrenadinesSub-Saharan Africa Sub-Saharan Africa (excluding high income)Sub-Saharan Africa (IDA & IBRD countries)SudanSurinameSwazilandSwedenSwitzerlandSyrian Arab RepublicTajikistanTanzaniaThailandTimor-LesteTogoTongaTrinidad and TobagoTunisiaTurkeyTuvaluUgandaUkraineUnited KingdomUnited StatesUpper middle incomeUruguayVanuatuVenezuela, RBVietnamWest Bank and GazaWorldYemen, Rep.ZambiaZimbabwe Timeline:
This timeline shows a graph from 1969 to 2016 of Dominican Republic. No data until 1968. Number of actual observations by date: 48.
Source name:
World Development Indicators
Source organization:
International Monetary Fund, Balance of Payments Statistics Yearbook and data files.
Categories, topics:
Economy & Growth, External Debt, Trade
Last updated:
apr 23, 2017
Indicators value changes by year
Minimum:
285.7 mln
jan 1, 1969
Maximum:
23.925 bln
jan 1, 2015
At the date of observation
Value
Absolute change
Change from previous value
jan 1, 1969
285.7 mln
+285.7 mln
0.0%
jan 1, 1970
321.1 mln
+35.4 mln
12.39%
jan 1, 1971
391.6 mln
+70.5 mln
21.96%
jan 1, 1972
438.5 mln
+46.9 mln
11.98%
jan 1, 1973
490.2 mln
+51.7 mln
11.79%
jan 1, 1974
643.6 mln
+153.4 mln
31.29%
jan 1, 1975
1.011 bln
+367.6 mln
57.12%
jan 1, 1976
1.127 bln
+115.8 mln
11.45%
jan 1, 1977
1.108 bln
-18.9 mln
-1.68%
jan 1, 1978
1.208 bln
+99.6 mln
8.99%
jan 1, 1979
1.31 bln
+102.8 mln
8.51%
jan 1, 1980
1.704 bln
+393.4 mln
30.02%
jan 1, 1981
2.237 bln
+533.6 mln
31.32%
jan 1, 1982
2.107 bln
-130.7 mln
-5.84%
jan 1, 1983
1.794 bln
-313.0 mln
-14.86%
jan 1, 1984
1.882 bln
+87.8 mln
4.89%
jan 1, 1985
1.804 bln
-77.8 mln
-4.13%
jan 1, 1986
1.808 bln
+4.5 mln
0.25%
jan 1, 1987
1.901 bln
+93.2 mln
5.15%
jan 1, 1988
2.27 bln
+368.1 mln
19.36%
jan 1, 1989
2.284 bln
+14.5 mln
0.64%
jan 1, 1990
2.784 bln
+500.2 mln
21.9%
jan 1, 1991
2.568 bln
-216.1 mln
-7.76%
jan 1, 1992
2.488 bln
-80.2 mln
-3.12%
jan 1, 1993
3.106 bln
+617.5 mln
24.82%
jan 1, 1994
4.42 bln
+1.314 bln
42.32%
jan 1, 1995
4.696 bln
+276.3 mln
6.25%
jan 1, 1996
5.028 bln
+331.6 mln
7.06%
jan 1, 1997
5.557 bln
+529.5 mln
10.53%
jan 1, 1998
6.299 bln
+741.9 mln
13.35%
jan 1, 1999
7.274 bln
+975.3 mln
15.48%
jan 1, 2000
7.648 bln
+373.6 mln
5.14%
jan 1, 2001
9.13 bln
+1.482 bln
19.38%
jan 1, 2002
8.6 bln
-530.6 mln
-5.81%
jan 1, 2003
9.003 bln
+403.3 mln
4.69%
jan 1, 2004
8.049 bln
-953.87 mln
-10.6%
jan 1, 2005
8.731 bln
+681.76 mln
8.47%
jan 1, 2006
11.183 bln
+2.452 bln
28.09%
jan 1, 2007
13.723 bln
+2.539 bln
22.71%
jan 1, 2008
15.882 bln
+2.159 bln
15.73%
jan 1, 2009
18.031 bln
+2.15 bln
13.54%
jan 1, 2010
13.986 bln
-4.045 bln
-22.43%
jan 1, 2011
20.983 bln
+6.996 bln
50.02%
jan 1, 2012
23.081 bln
+2.099 bln
10.0%
jan 1, 2013
23.634 bln
+552.77 mln
2.39%
jan 1, 2014
23.222 bln
-411.518 mln
-1.74%
jan 1, 2015
23.925 bln
+702.903 mln
3.03%
jan 1, 2016
23.601 bln
-324.086 mln
-1.35%
Ranking of countries by current statistics by years


Comments: