29
/
en
AIzaSyAYiBZKx7MnpbEhh9jyipgxe19OcubqV5w
April 1, 2024
62689
World
WLD
false
2
1
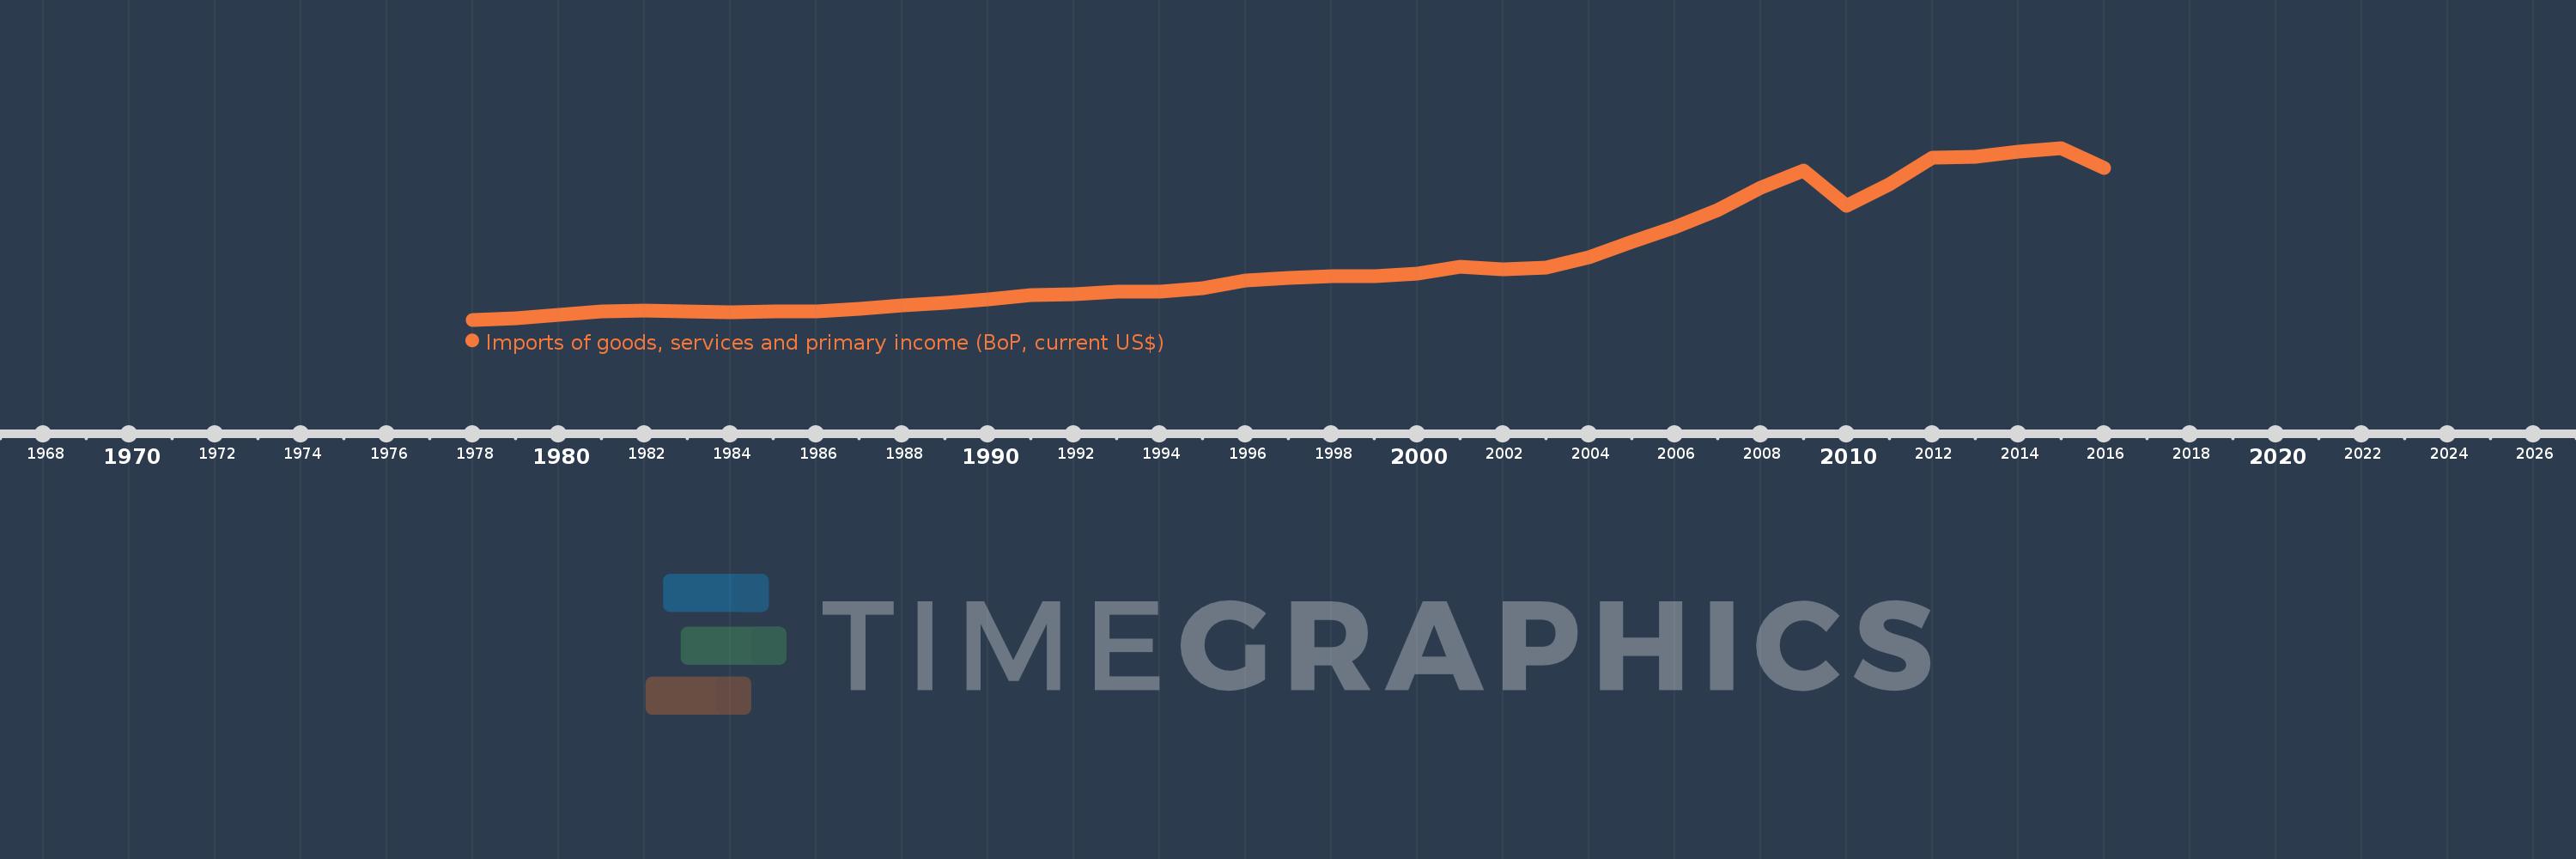
Imports of goods, services and primary income (BoP, current US$)
2016,2015,2014,2013,2012,2011,2010,2009,2008,2007,2006,2005,2004,2003,2002,2001,2000,1999,1998,1997,1996,1995,1994,1993,1992,1991,1990,1989,1988,1987,1986,1985,1984,1983,1982,1981,1980,1979,1978
This statistics in other country:
AfghanistanAlbaniaAlgeriaAngolaAntigua and BarbudaArab WorldArgentinaArmeniaArubaAustraliaAustriaAzerbaijanBahamas, TheBahrainBangladeshBarbadosBelarusBelgiumBelizeBeninBermudaBhutanBoliviaBosnia and HerzegovinaBotswanaBrazilBrunei DarussalamBulgariaBurkina FasoBurundiCabo VerdeCambodiaCameroonCanadaCaribbean small statesCentral African RepublicCentral Europe and the BalticsChadChileChinaColombiaComorosCongo, Dem. Rep.Congo, Rep.Costa RicaCote d'IvoireCroatiaCuracaoCyprusCzech RepublicDenmarkDjiboutiDominicaDominican RepublicEarly-demographic dividendEast Asia & PacificEast Asia & Pacific (excluding high income)East Asia & Pacific (IDA & IBRD countries)EcuadorEgypt, Arab Rep.El SalvadorEquatorial GuineaEritreaEstoniaEthiopiaEuro areaEurope & Central AsiaEurope & Central Asia (excluding high income)Europe & Central Asia (IDA & IBRD countries)European UnionFaroe IslandsFijiFinlandFragile and conflict affected situationsFranceFrench PolynesiaGabonGambia, TheGeorgiaGermanyGhanaGreeceGrenadaGuatemalaGuineaGuinea-BissauGuyanaHaitiHeavily indebted poor countries (HIPC)High incomeHondurasHong Kong SAR, ChinaHungaryIBRD onlyIcelandIDA & IBRD totalIDA blendIDA onlyIDA totalIndiaIndonesiaIran, Islamic Rep.IraqIrelandIsraelItalyJamaicaJapanJordanKazakhstanKenyaKiribatiKorea, Rep.KosovoKuwaitKyrgyz RepublicLao PDRLate-demographic dividendLatin America & Caribbean Latin America & Caribbean (excluding high income)Latin America & the Caribbean (IDA & IBRD countries)LatviaLeast developed countries: UN classificationLebanonLesothoLiberiaLibyaLithuaniaLow & middle incomeLow incomeLower middle incomeLuxembourgMacao SAR, ChinaMacedonia, FYRMadagascarMalawiMalaysiaMaldivesMaliMaltaMarshall IslandsMauritaniaMauritiusMexicoMicronesia, Fed. Sts.Middle East & North Africa (excluding high income)Middle East & North Africa (IDA & IBRD countries)Middle incomeMoldovaMongoliaMontenegroMoroccoMozambiqueMyanmarNamibiaNepalNetherlandsNew CaledoniaNicaraguaNigerNigeriaNorth AmericaNorwayOECD membersOmanOther small statesPacific island small statesPakistanPalauPanamaPapua New GuineaParaguayPeruPhilippinesPolandPortugalPost-demographic dividendPre-demographic dividendQatarRomaniaRussian FederationRwandaSamoaSao Tome and PrincipeSaudi ArabiaSenegalSerbiaSeychellesSierra LeoneSingaporeSint Maarten (Dutch part)Slovak RepublicSloveniaSmall statesSolomon IslandsSouth AfricaSouth AsiaSouth Asia (IDA & IBRD)South SudanSpainSri LankaSt. Kitts and NevisSt. LuciaSt. Vincent and the GrenadinesSub-Saharan Africa Sub-Saharan Africa (excluding high income)Sub-Saharan Africa (IDA & IBRD countries)SudanSurinameSwazilandSwedenSwitzerlandSyrian Arab RepublicTajikistanTanzaniaThailandTimor-LesteTogoTongaTrinidad and TobagoTunisiaTurkeyTuvaluUgandaUkraineUnited KingdomUnited StatesUpper middle incomeUruguayVanuatuVenezuela, RBVietnamWest Bank and GazaWorldYemen, Rep.ZambiaZimbabwe Timeline:
This timeline shows a graph from 1978 to 2016 of World. No data until 1977. Number of actual observations by date: 39.
Source name:
World Development Indicators
Source organization:
International Monetary Fund, Balance of Payments Statistics Yearbook and data files.
Categories, topics:
Economy & Growth, External Debt, Trade
Last updated:
apr 23, 2017
Indicators value changes by year
Minimum:
1.502 trl
jan 1, 1978
Maximum:
27.324 trl
jan 1, 2015
At the date of observation
Value
Absolute change
Change from previous value
jan 1, 1978
1.502 trl
+1.502 trl
0.0%
jan 1, 1979
1.761 trl
+258.285 bln
17.19%
jan 1, 1980
2.24 trl
+479.771 bln
27.25%
jan 1, 1981
2.759 trl
+518.231 bln
23.13%
jan 1, 1982
2.859 trl
+100.95 bln
3.66%
jan 1, 1983
2.727 trl
-132.601 bln
-4.64%
jan 1, 1984
2.627 trl
-100.112 bln
-3.67%
jan 1, 1985
2.786 trl
+158.975 bln
6.05%
jan 1, 1986
2.811 trl
+25.472 bln
0.91%
jan 1, 1987
3.087 trl
+276.189 bln
9.82%
jan 1, 1988
3.604 trl
+516.249 bln
16.72%
jan 1, 1989
4.108 trl
+504.41 bln
14.0%
jan 1, 1990
4.502 trl
+393.932 bln
9.59%
jan 1, 1991
5.213 trl
+711.368 bln
15.8%
jan 1, 1992
5.386 trl
+173.029 bln
3.32%
jan 1, 1993
5.746 trl
+360.102 bln
6.69%
jan 1, 1994
5.676 trl
-70.553 bln
-1.23%
jan 1, 1995
6.202 trl
+526.437 bln
9.27%
jan 1, 1996
7.4 trl
+1.198 trl
19.31%
jan 1, 1997
7.814 trl
+413.8 bln
5.59%
jan 1, 1998
8.022 trl
+207.89 bln
2.66%
jan 1, 1999
8.052 trl
+30.161 bln
0.38%
jan 1, 2000
8.431 trl
+378.512 bln
4.7%
jan 1, 2001
9.488 trl
+1.058 trl
12.55%
jan 1, 2002
9.094 trl
-394.205 bln
-4.15%
jan 1, 2003
9.313 trl
+218.485 bln
2.4%
jan 1, 2004
10.856 trl
+1.544 trl
16.58%
jan 1, 2005
13.267 trl
+2.411 trl
22.21%
jan 1, 2006
15.375 trl
+2.108 trl
15.89%
jan 1, 2007
17.967 trl
+2.591 trl
16.85%
jan 1, 2008
21.292 trl
+3.325 trl
18.51%
jan 1, 2009
23.914 trl
+2.623 trl
12.32%
jan 1, 2010
18.663 trl
-5.251 trl
-21.96%
jan 1, 2011
21.873 trl
+3.21 trl
17.2%
jan 1, 2012
25.886 trl
+4.013 trl
18.35%
jan 1, 2013
26.03 trl
+143.422 bln
0.55%
jan 1, 2014
26.756 trl
+726.807 bln
2.79%
jan 1, 2015
27.324 trl
+567.471 bln
2.12%
jan 1, 2016
24.36 trl
-2.964 trl
-10.85%
Ranking of countries by current statistics by years


Comments: