29
/
en
AIzaSyAYiBZKx7MnpbEhh9jyipgxe19OcubqV5w
April 1, 2024
210502
Nicaragua
NIC
true
2
1
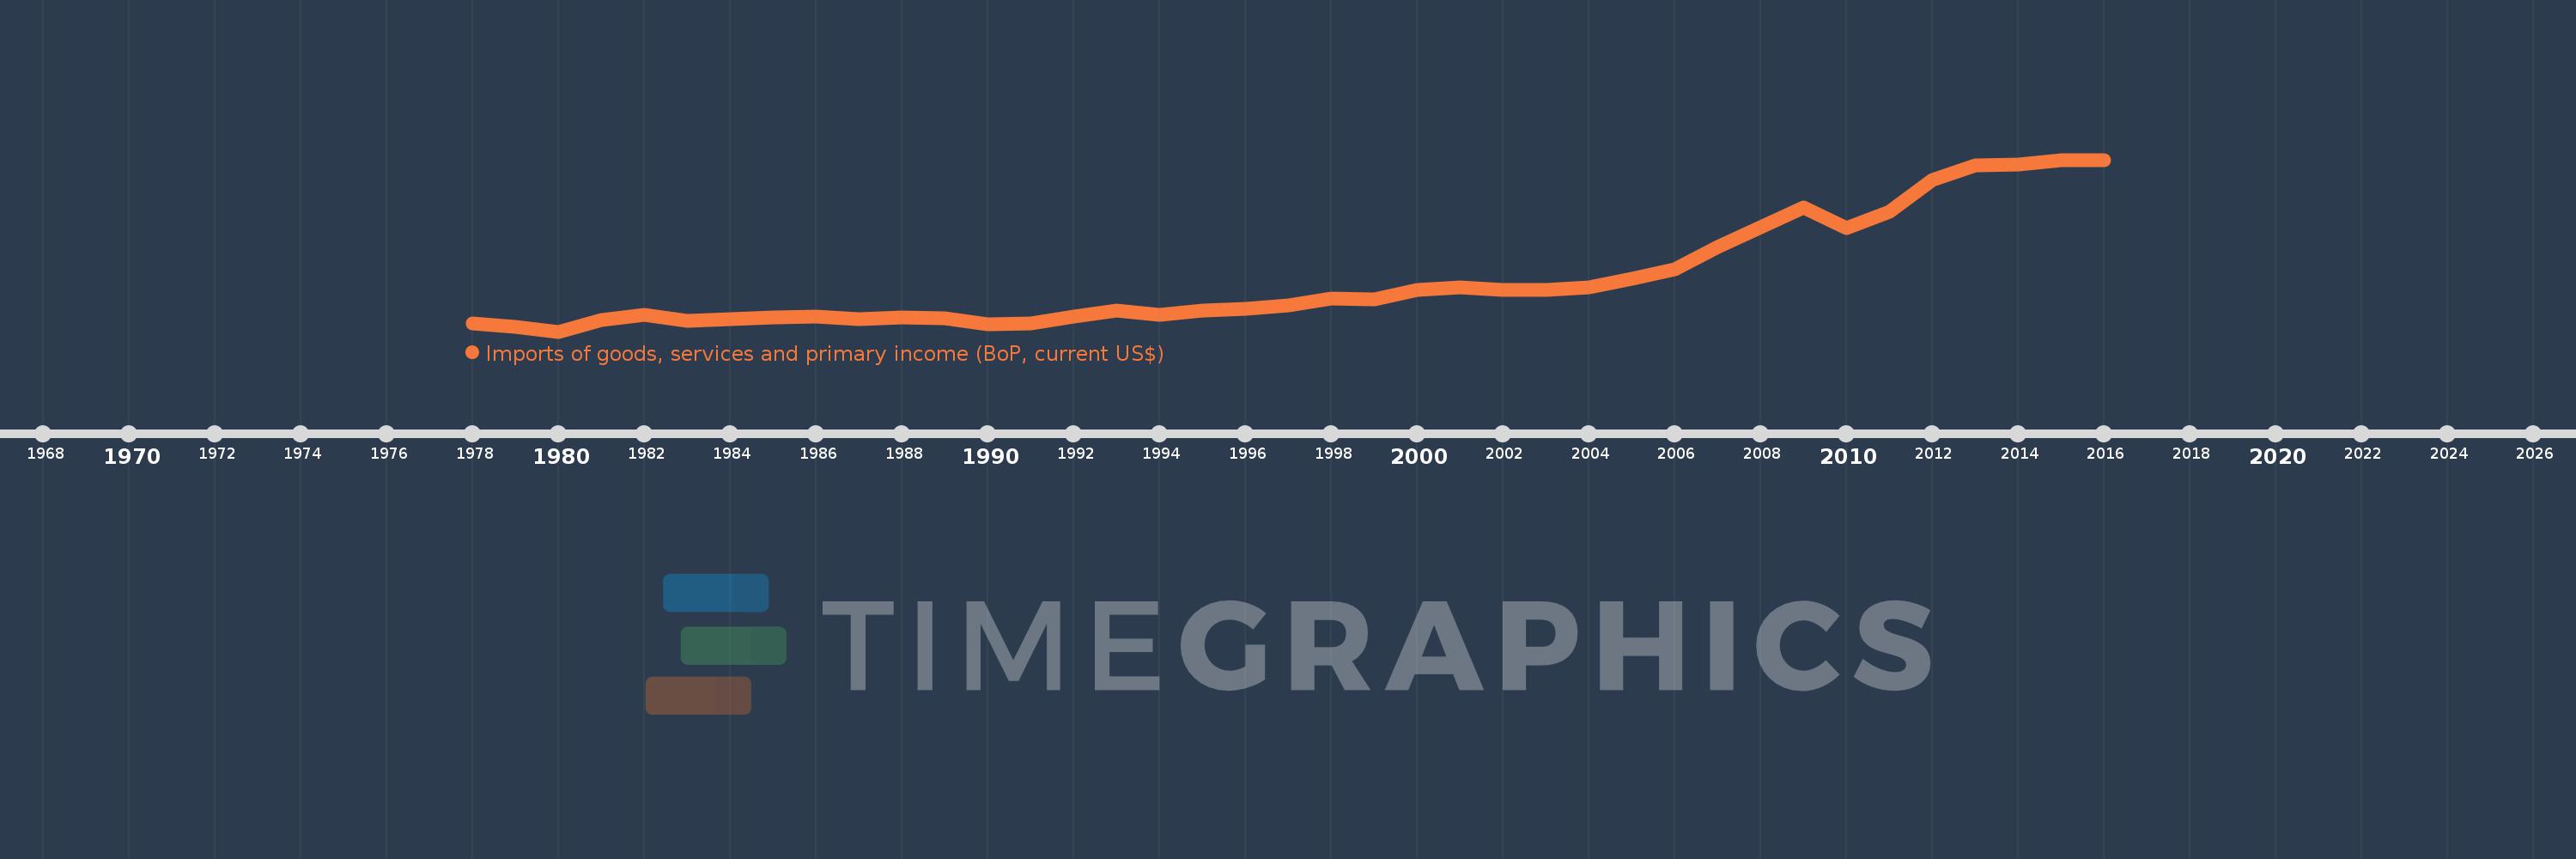
Imports of goods, services and primary income (BoP, current US$)
2016,2015,2014,2013,2012,2011,2010,2009,2008,2007,2006,2005,2004,2003,2002,2001,2000,1999,1998,1997,1996,1995,1994,1993,1992,1991,1990,1989,1988,1987,1986,1985,1984,1983,1982,1981,1980,1979,1978
This statistics in other country:
AfghanistanAlbaniaAlgeriaAngolaAntigua and BarbudaArab WorldArgentinaArmeniaArubaAustraliaAustriaAzerbaijanBahamas, TheBahrainBangladeshBarbadosBelarusBelgiumBelizeBeninBermudaBhutanBoliviaBosnia and HerzegovinaBotswanaBrazilBrunei DarussalamBulgariaBurkina FasoBurundiCabo VerdeCambodiaCameroonCanadaCaribbean small statesCentral African RepublicCentral Europe and the BalticsChadChileChinaColombiaComorosCongo, Dem. Rep.Congo, Rep.Costa RicaCote d'IvoireCroatiaCuracaoCyprusCzech RepublicDenmarkDjiboutiDominicaDominican RepublicEarly-demographic dividendEast Asia & PacificEast Asia & Pacific (excluding high income)East Asia & Pacific (IDA & IBRD countries)EcuadorEgypt, Arab Rep.El SalvadorEquatorial GuineaEritreaEstoniaEthiopiaEuro areaEurope & Central AsiaEurope & Central Asia (excluding high income)Europe & Central Asia (IDA & IBRD countries)European UnionFaroe IslandsFijiFinlandFragile and conflict affected situationsFranceFrench PolynesiaGabonGambia, TheGeorgiaGermanyGhanaGreeceGrenadaGuatemalaGuineaGuinea-BissauGuyanaHaitiHeavily indebted poor countries (HIPC)High incomeHondurasHong Kong SAR, ChinaHungaryIBRD onlyIcelandIDA & IBRD totalIDA blendIDA onlyIDA totalIndiaIndonesiaIran, Islamic Rep.IraqIrelandIsraelItalyJamaicaJapanJordanKazakhstanKenyaKiribatiKorea, Rep.KosovoKuwaitKyrgyz RepublicLao PDRLate-demographic dividendLatin America & Caribbean Latin America & Caribbean (excluding high income)Latin America & the Caribbean (IDA & IBRD countries)LatviaLeast developed countries: UN classificationLebanonLesothoLiberiaLibyaLithuaniaLow & middle incomeLow incomeLower middle incomeLuxembourgMacao SAR, ChinaMacedonia, FYRMadagascarMalawiMalaysiaMaldivesMaliMaltaMarshall IslandsMauritaniaMauritiusMexicoMicronesia, Fed. Sts.Middle East & North Africa (excluding high income)Middle East & North Africa (IDA & IBRD countries)Middle incomeMoldovaMongoliaMontenegroMoroccoMozambiqueMyanmarNamibiaNepalNetherlandsNew CaledoniaNicaraguaNigerNigeriaNorth AmericaNorwayOECD membersOmanOther small statesPacific island small statesPakistanPalauPanamaPapua New GuineaParaguayPeruPhilippinesPolandPortugalPost-demographic dividendPre-demographic dividendQatarRomaniaRussian FederationRwandaSamoaSao Tome and PrincipeSaudi ArabiaSenegalSerbiaSeychellesSierra LeoneSingaporeSint Maarten (Dutch part)Slovak RepublicSloveniaSmall statesSolomon IslandsSouth AfricaSouth AsiaSouth Asia (IDA & IBRD)South SudanSpainSri LankaSt. Kitts and NevisSt. LuciaSt. Vincent and the GrenadinesSub-Saharan Africa Sub-Saharan Africa (excluding high income)Sub-Saharan Africa (IDA & IBRD countries)SudanSurinameSwazilandSwedenSwitzerlandSyrian Arab RepublicTajikistanTanzaniaThailandTimor-LesteTogoTongaTrinidad and TobagoTunisiaTurkeyTuvaluUgandaUkraineUnited KingdomUnited StatesUpper middle incomeUruguayVanuatuVenezuela, RBVietnamWest Bank and GazaWorldYemen, Rep.ZambiaZimbabwe Timeline:
This timeline shows a graph from 1978 to 2016 of Nicaragua. No data until 1977. Number of actual observations by date: 39.
Source name:
World Development Indicators
Source organization:
International Monetary Fund, Balance of Payments Statistics Yearbook and data files.
Categories, topics:
Economy & Growth, External Debt, Trade
Last updated:
apr 23, 2017
Indicators value changes by year
Minimum:
594.6 mln
jan 1, 1980
Maximum:
7.396 bln
jan 1, 2016
At the date of observation
Value
Absolute change
Change from previous value
jan 1, 1978
926.0 mln
+926.0 mln
0.0%
jan 1, 1979
766.3 mln
-159.7 mln
-17.25%
jan 1, 1980
594.6 mln
-171.7 mln
-22.41%
jan 1, 1981
1.049 bln
+454.72 mln
76.47%
jan 1, 1982
1.244 bln
+194.18 mln
18.51%
jan 1, 1983
1.021 bln
-222.6 mln
-17.9%
jan 1, 1984
1.091 bln
+70.3 mln
6.89%
jan 1, 1985
1.152 bln
+61.1 mln
5.6%
jan 1, 1986
1.198 bln
+46.2 mln
4.01%
jan 1, 1987
1.091 bln
-107.7 mln
-8.99%
jan 1, 1988
1.14 bln
+49.4 mln
4.53%
jan 1, 1989
1.121 bln
-19.6 mln
-1.72%
jan 1, 1990
878.1 mln
-242.5 mln
-21.64%
jan 1, 1991
910.8 mln
+32.7 mln
3.72%
jan 1, 1992
1.197 bln
+286.4 mln
31.44%
jan 1, 1993
1.421 bln
+224.2 mln
18.73%
jan 1, 1994
1.25 bln
-170.9 mln
-12.02%
jan 1, 1995
1.432 bln
+181.8 mln
14.54%
jan 1, 1996
1.481 bln
+48.8 mln
3.41%
jan 1, 1997
1.631 bln
+149.9 mln
10.12%
jan 1, 1998
1.889 bln
+258.4 mln
15.84%
jan 1, 1999
1.876 bln
-13.4 mln
-0.71%
jan 1, 2000
2.26 bln
+384.3 mln
20.49%
jan 1, 2001
2.33 bln
+69.9 mln
3.09%
jan 1, 2002
2.251 bln
-78.9 mln
-3.39%
jan 1, 2003
2.228 bln
-23.3 mln
-1.03%
jan 1, 2004
2.35 bln
+122.4 mln
5.49%
jan 1, 2005
2.677 bln
+326.5 mln
13.89%
jan 1, 2006
3.075 bln
+397.9 mln
14.86%
jan 1, 2007
3.942 bln
+867.4 mln
28.21%
jan 1, 2008
4.712 bln
+769.9 mln
19.53%
jan 1, 2009
5.519 bln
+807.1 mln
17.13%
jan 1, 2010
4.686 bln
-833.7 mln
-15.11%
jan 1, 2011
5.33 bln
+644.1 mln
13.75%
jan 1, 2012
6.599 bln
+1.269 bln
23.81%
jan 1, 2013
7.169 bln
+569.746 mln
8.63%
jan 1, 2014
7.223 bln
+54.354 mln
0.76%
jan 1, 2015
7.394 bln
+171.2 mln
2.37%
jan 1, 2016
7.396 bln
+1.5 mln
0.02%
Ranking of countries by current statistics by years


Comments: