29
/
en
AIzaSyAYiBZKx7MnpbEhh9jyipgxe19OcubqV5w
April 1, 2024
69941
Argentina
ARG
true
2
1
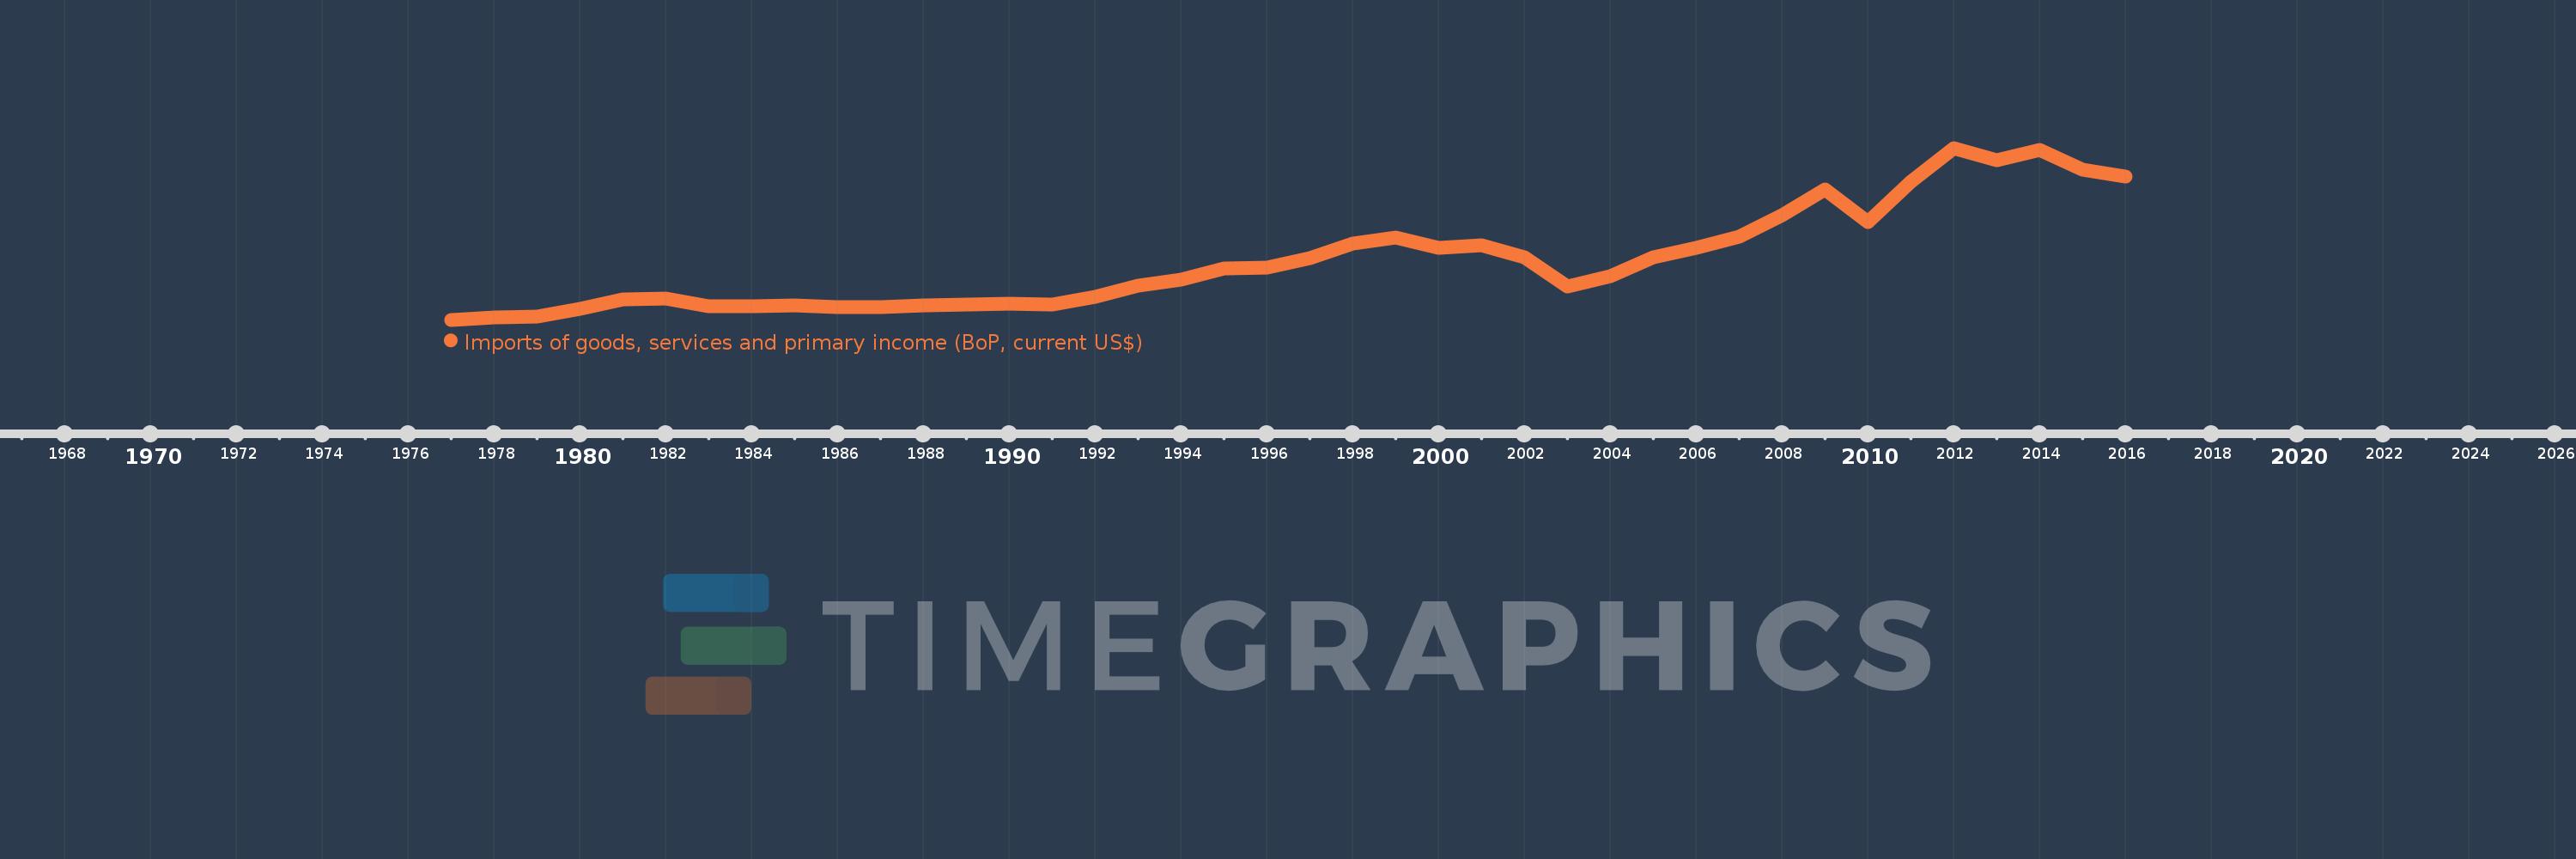
Imports of goods, services and primary income (BoP, current US$)
2016,2015,2014,2013,2012,2011,2010,2009,2008,2007,2006,2005,2004,2003,2002,2001,2000,1999,1998,1997,1996,1995,1994,1993,1992,1991,1990,1989,1988,1987,1986,1985,1984,1983,1982,1981,1980,1979,1978,1977
This statistics in other country:
AfghanistanAlbaniaAlgeriaAngolaAntigua and BarbudaArab WorldArgentinaArmeniaArubaAustraliaAustriaAzerbaijanBahamas, TheBahrainBangladeshBarbadosBelarusBelgiumBelizeBeninBermudaBhutanBoliviaBosnia and HerzegovinaBotswanaBrazilBrunei DarussalamBulgariaBurkina FasoBurundiCabo VerdeCambodiaCameroonCanadaCaribbean small statesCentral African RepublicCentral Europe and the BalticsChadChileChinaColombiaComorosCongo, Dem. Rep.Congo, Rep.Costa RicaCote d'IvoireCroatiaCuracaoCyprusCzech RepublicDenmarkDjiboutiDominicaDominican RepublicEarly-demographic dividendEast Asia & PacificEast Asia & Pacific (excluding high income)East Asia & Pacific (IDA & IBRD countries)EcuadorEgypt, Arab Rep.El SalvadorEquatorial GuineaEritreaEstoniaEthiopiaEuro areaEurope & Central AsiaEurope & Central Asia (excluding high income)Europe & Central Asia (IDA & IBRD countries)European UnionFaroe IslandsFijiFinlandFragile and conflict affected situationsFranceFrench PolynesiaGabonGambia, TheGeorgiaGermanyGhanaGreeceGrenadaGuatemalaGuineaGuinea-BissauGuyanaHaitiHeavily indebted poor countries (HIPC)High incomeHondurasHong Kong SAR, ChinaHungaryIBRD onlyIcelandIDA & IBRD totalIDA blendIDA onlyIDA totalIndiaIndonesiaIran, Islamic Rep.IraqIrelandIsraelItalyJamaicaJapanJordanKazakhstanKenyaKiribatiKorea, Rep.KosovoKuwaitKyrgyz RepublicLao PDRLate-demographic dividendLatin America & Caribbean Latin America & Caribbean (excluding high income)Latin America & the Caribbean (IDA & IBRD countries)LatviaLeast developed countries: UN classificationLebanonLesothoLiberiaLibyaLithuaniaLow & middle incomeLow incomeLower middle incomeLuxembourgMacao SAR, ChinaMacedonia, FYRMadagascarMalawiMalaysiaMaldivesMaliMaltaMarshall IslandsMauritaniaMauritiusMexicoMicronesia, Fed. Sts.Middle East & North Africa (excluding high income)Middle East & North Africa (IDA & IBRD countries)Middle incomeMoldovaMongoliaMontenegroMoroccoMozambiqueMyanmarNamibiaNepalNetherlandsNew CaledoniaNicaraguaNigerNigeriaNorth AmericaNorwayOECD membersOmanOther small statesPacific island small statesPakistanPalauPanamaPapua New GuineaParaguayPeruPhilippinesPolandPortugalPost-demographic dividendPre-demographic dividendQatarRomaniaRussian FederationRwandaSamoaSao Tome and PrincipeSaudi ArabiaSenegalSerbiaSeychellesSierra LeoneSingaporeSint Maarten (Dutch part)Slovak RepublicSloveniaSmall statesSolomon IslandsSouth AfricaSouth AsiaSouth Asia (IDA & IBRD)South SudanSpainSri LankaSt. Kitts and NevisSt. LuciaSt. Vincent and the GrenadinesSub-Saharan Africa Sub-Saharan Africa (excluding high income)Sub-Saharan Africa (IDA & IBRD countries)SudanSurinameSwazilandSwedenSwitzerlandSyrian Arab RepublicTajikistanTanzaniaThailandTimor-LesteTogoTongaTrinidad and TobagoTunisiaTurkeyTuvaluUgandaUkraineUnited KingdomUnited StatesUpper middle incomeUruguayVanuatuVenezuela, RBVietnamWest Bank and GazaWorldYemen, Rep.ZambiaZimbabwe Timeline:
This timeline shows a graph from 1977 to 2016 of Argentina. No data until 1976. Number of actual observations by date: 40.
Source name:
World Development Indicators
Source organization:
International Monetary Fund, Balance of Payments Statistics Yearbook and data files.
Categories, topics:
Economy & Growth, External Debt, Trade
Last updated:
apr 23, 2017
Indicators value changes by year
Minimum:
4.058 bln
jan 1, 1977
Maximum:
105.356 bln
jan 1, 2012
At the date of observation
Value
Absolute change
Change from previous value
jan 1, 1977
4.058 bln
+4.058 bln
0.0%
jan 1, 1978
5.643 bln
+1.585 bln
39.06%
jan 1, 1979
6.048 bln
+405.0 mln
7.18%
jan 1, 1980
10.486 bln
+4.438 bln
73.38%
jan 1, 1981
15.999 bln
+5.513 bln
52.57%
jan 1, 1982
16.495 bln
+496.0 mln
3.1%
jan 1, 1983
12.142 bln
-4.353 bln
-26.39%
jan 1, 1984
12.216 bln
+74.0 mln
0.61%
jan 1, 1985
12.406 bln
+190.0 mln
1.56%
jan 1, 1986
11.281 bln
-1.125 bln
-9.07%
jan 1, 1987
11.702 bln
+421.0 mln
3.73%
jan 1, 1988
12.633 bln
+931.0 mln
7.96%
jan 1, 1989
12.932 bln
+299.0 mln
2.37%
jan 1, 1990
13.355 bln
+423.0 mln
3.27%
jan 1, 1991
13.1 bln
-255.0 mln
-1.91%
jan 1, 1992
17.572 bln
+4.472 bln
34.14%
jan 1, 1993
24.078 bln
+6.506 bln
37.02%
jan 1, 1994
27.58 bln
+3.502 bln
14.54%
jan 1, 1995
34.312 bln
+6.733 bln
24.41%
jan 1, 1996
35.04 bln
+727.139 mln
2.12%
jan 1, 1997
40.121 bln
+5.081 bln
14.5%
jan 1, 1998
49.144 bln
+9.023 bln
22.49%
jan 1, 1999
52.336 bln
+3.192 bln
6.49%
jan 1, 2000
46.469 bln
-5.867 bln
-11.21%
jan 1, 2001
48.037 bln
+1.568 bln
3.37%
jan 1, 2002
40.68 bln
-7.357 bln
-15.32%
jan 1, 2003
23.867 bln
-16.813 bln
-41.33%
jan 1, 2004
29.804 bln
+5.937 bln
24.88%
jan 1, 2005
40.827 bln
+11.023 bln
36.99%
jan 1, 2006
46.414 bln
+5.587 bln
13.68%
jan 1, 2007
52.809 bln
+6.395 bln
13.78%
jan 1, 2008
65.793 bln
+12.984 bln
24.59%
jan 1, 2009
81.023 bln
+15.23 bln
23.15%
jan 1, 2010
61.832 bln
-19.19 bln
-23.69%
jan 1, 2011
85.428 bln
+23.595 bln
38.16%
jan 1, 2012
105.356 bln
+19.928 bln
23.33%
jan 1, 2013
98.143 bln
-7.214 bln
-6.85%
jan 1, 2014
104.279 bln
+6.136 bln
6.25%
jan 1, 2015
92.579 bln
-11.7 bln
-11.22%
jan 1, 2016
88.62 bln
-3.959 bln
-4.28%
Ranking of countries by current statistics by years


Comments: