29
/
en
AIzaSyAYiBZKx7MnpbEhh9jyipgxe19OcubqV5w
April 1, 2024
204212
Myanmar
MMR
true
2
1
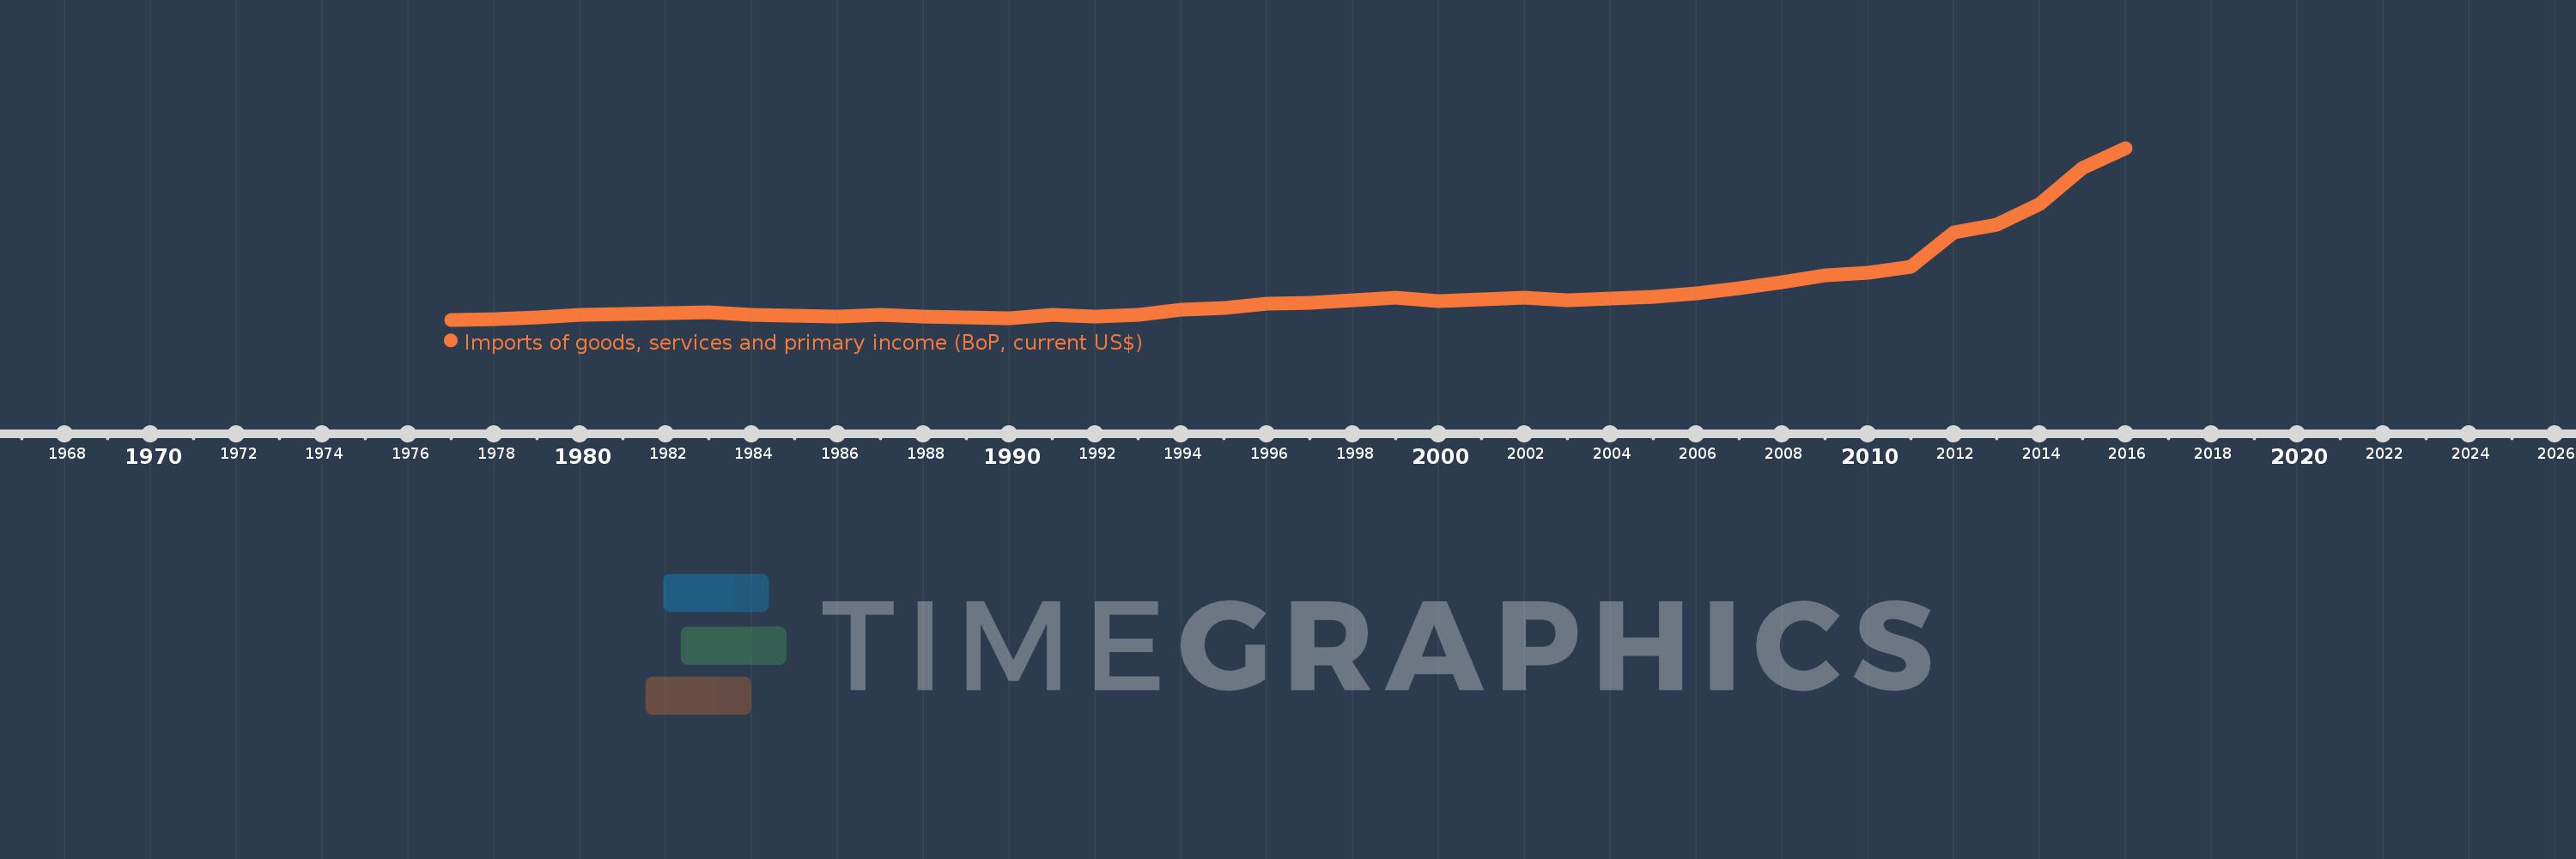
Imports of goods, services and primary income (BoP, current US$)
2016,2015,2014,2013,2012,2011,2010,2009,2008,2007,2006,2005,2004,2003,2002,2001,2000,1999,1998,1997,1996,1995,1994,1993,1992,1991,1990,1989,1988,1987,1986,1985,1984,1983,1982,1981,1980,1979,1978,1977
This statistics in other country:
AfghanistanAlbaniaAlgeriaAngolaAntigua and BarbudaArab WorldArgentinaArmeniaArubaAustraliaAustriaAzerbaijanBahamas, TheBahrainBangladeshBarbadosBelarusBelgiumBelizeBeninBermudaBhutanBoliviaBosnia and HerzegovinaBotswanaBrazilBrunei DarussalamBulgariaBurkina FasoBurundiCabo VerdeCambodiaCameroonCanadaCaribbean small statesCentral African RepublicCentral Europe and the BalticsChadChileChinaColombiaComorosCongo, Dem. Rep.Congo, Rep.Costa RicaCote d'IvoireCroatiaCuracaoCyprusCzech RepublicDenmarkDjiboutiDominicaDominican RepublicEarly-demographic dividendEast Asia & PacificEast Asia & Pacific (excluding high income)East Asia & Pacific (IDA & IBRD countries)EcuadorEgypt, Arab Rep.El SalvadorEquatorial GuineaEritreaEstoniaEthiopiaEuro areaEurope & Central AsiaEurope & Central Asia (excluding high income)Europe & Central Asia (IDA & IBRD countries)European UnionFaroe IslandsFijiFinlandFragile and conflict affected situationsFranceFrench PolynesiaGabonGambia, TheGeorgiaGermanyGhanaGreeceGrenadaGuatemalaGuineaGuinea-BissauGuyanaHaitiHeavily indebted poor countries (HIPC)High incomeHondurasHong Kong SAR, ChinaHungaryIBRD onlyIcelandIDA & IBRD totalIDA blendIDA onlyIDA totalIndiaIndonesiaIran, Islamic Rep.IraqIrelandIsraelItalyJamaicaJapanJordanKazakhstanKenyaKiribatiKorea, Rep.KosovoKuwaitKyrgyz RepublicLao PDRLate-demographic dividendLatin America & Caribbean Latin America & Caribbean (excluding high income)Latin America & the Caribbean (IDA & IBRD countries)LatviaLeast developed countries: UN classificationLebanonLesothoLiberiaLibyaLithuaniaLow & middle incomeLow incomeLower middle incomeLuxembourgMacao SAR, ChinaMacedonia, FYRMadagascarMalawiMalaysiaMaldivesMaliMaltaMarshall IslandsMauritaniaMauritiusMexicoMicronesia, Fed. Sts.Middle East & North Africa (excluding high income)Middle East & North Africa (IDA & IBRD countries)Middle incomeMoldovaMongoliaMontenegroMoroccoMozambiqueMyanmarNamibiaNepalNetherlandsNew CaledoniaNicaraguaNigerNigeriaNorth AmericaNorwayOECD membersOmanOther small statesPacific island small statesPakistanPalauPanamaPapua New GuineaParaguayPeruPhilippinesPolandPortugalPost-demographic dividendPre-demographic dividendQatarRomaniaRussian FederationRwandaSamoaSao Tome and PrincipeSaudi ArabiaSenegalSerbiaSeychellesSierra LeoneSingaporeSint Maarten (Dutch part)Slovak RepublicSloveniaSmall statesSolomon IslandsSouth AfricaSouth AsiaSouth Asia (IDA & IBRD)South SudanSpainSri LankaSt. Kitts and NevisSt. LuciaSt. Vincent and the GrenadinesSub-Saharan Africa Sub-Saharan Africa (excluding high income)Sub-Saharan Africa (IDA & IBRD countries)SudanSurinameSwazilandSwedenSwitzerlandSyrian Arab RepublicTajikistanTanzaniaThailandTimor-LesteTogoTongaTrinidad and TobagoTunisiaTurkeyTuvaluUgandaUkraineUnited KingdomUnited StatesUpper middle incomeUruguayVanuatuVenezuela, RBVietnamWest Bank and GazaWorldYemen, Rep.ZambiaZimbabwe Timeline:
This timeline shows a graph from 1977 to 2016 of Myanmar. No data until 1976. Number of actual observations by date: 40.
Source name:
World Development Indicators
Source organization:
International Monetary Fund, Balance of Payments Statistics Yearbook and data files.
Categories, topics:
Economy & Growth, External Debt, Trade
Last updated:
apr 23, 2017
Indicators value changes by year
Minimum:
255.831 mln
jan 1, 1977
Maximum:
20.617 bln
jan 1, 2016
At the date of observation
Value
Absolute change
Change from previous value
jan 1, 1977
255.831 mln
+255.831 mln
0.0%
jan 1, 1978
360.242 mln
+104.411 mln
40.81%
jan 1, 1979
552.65 mln
+192.407 mln
53.41%
jan 1, 1980
836.767 mln
+284.117 mln
51.41%
jan 1, 1981
931.318 mln
+94.551 mln
11.3%
jan 1, 1982
1.033 bln
+101.993 mln
10.95%
jan 1, 1983
1.094 bln
+61.074 mln
5.91%
jan 1, 1984
883.849 mln
-210.535 mln
-19.24%
jan 1, 1985
723.374 mln
-160.475 mln
-18.16%
jan 1, 1986
665.776 mln
-57.598 mln
-7.96%
jan 1, 1987
788.598 mln
+122.822 mln
18.45%
jan 1, 1988
582.069 mln
-206.529 mln
-26.19%
jan 1, 1989
483.729 mln
-98.34 mln
-16.89%
jan 1, 1990
405.711 mln
-78.019 mln
-16.13%
jan 1, 1991
788.693 mln
+382.983 mln
94.4%
jan 1, 1992
628.08 mln
-160.613 mln
-20.36%
jan 1, 1993
829.995 mln
+201.915 mln
32.15%
jan 1, 1994
1.454 bln
+624.101 mln
75.19%
jan 1, 1995
1.67 bln
+215.662 mln
14.83%
jan 1, 1996
2.124 bln
+454.473 mln
27.22%
jan 1, 1997
2.224 bln
+99.846 mln
4.7%
jan 1, 1998
2.57 bln
+346.132 mln
15.56%
jan 1, 1999
2.827 bln
+257.071 mln
10.0%
jan 1, 2000
2.502 bln
-325.436 mln
-11.51%
jan 1, 2001
2.627 bln
+124.913 mln
4.99%
jan 1, 2002
2.891 bln
+264.721 mln
10.08%
jan 1, 2003
2.526 bln
-365.939 mln
-12.66%
jan 1, 2004
2.752 bln
+226.073 mln
8.95%
jan 1, 2005
2.983 bln
+230.902 mln
8.39%
jan 1, 2006
3.429 bln
+445.987 mln
14.95%
jan 1, 2007
3.959 bln
+530.857 mln
15.48%
jan 1, 2008
4.735 bln
+775.774 mln
19.59%
jan 1, 2009
5.5 bln
+764.769 mln
16.15%
jan 1, 2010
5.794 bln
+294.59 mln
5.36%
jan 1, 2011
6.516 bln
+721.494 mln
12.45%
jan 1, 2012
10.614 bln
+4.098 bln
62.89%
jan 1, 2013
11.555 bln
+940.861 mln
8.86%
jan 1, 2014
13.925 bln
+2.371 bln
20.52%
jan 1, 2015
18.291 bln
+4.366 bln
31.35%
jan 1, 2016
20.617 bln
+2.326 bln
12.72%
Ranking of countries by current statistics by years


Comments: