29
/
en
AIzaSyAYiBZKx7MnpbEhh9jyipgxe19OcubqV5w
April 1, 2024
27374
East Asia & Pacific
EAS
false
2
1
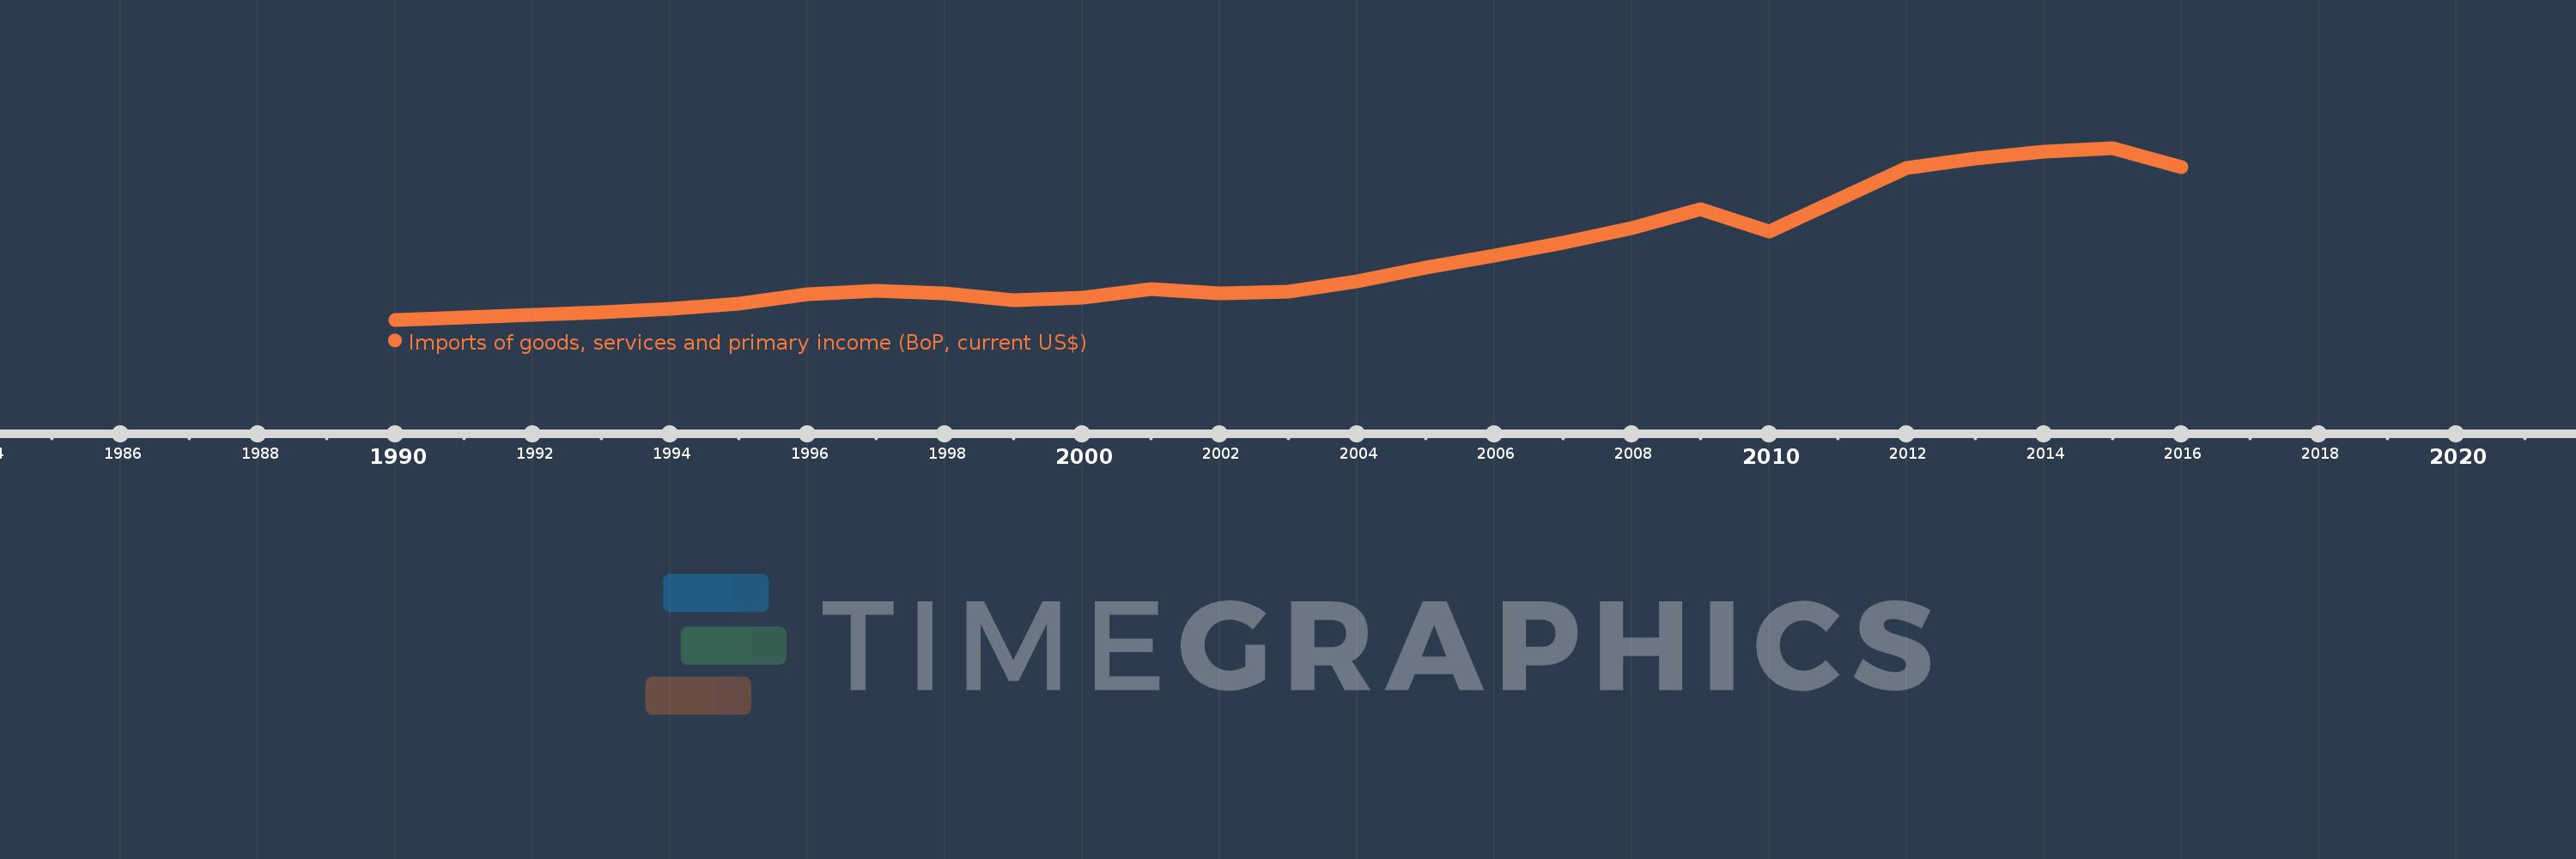
Imports of goods, services and primary income (BoP, current US$)
2016,2015,2014,2013,2012,2011,2010,2009,2008,2007,2006,2005,2004,2003,2002,2001,2000,1999,1998,1997,1996,1995,1994,1993,1992,1991,1990
This statistics in other country:
AfghanistanAlbaniaAlgeriaAngolaAntigua and BarbudaArab WorldArgentinaArmeniaArubaAustraliaAustriaAzerbaijanBahamas, TheBahrainBangladeshBarbadosBelarusBelgiumBelizeBeninBermudaBhutanBoliviaBosnia and HerzegovinaBotswanaBrazilBrunei DarussalamBulgariaBurkina FasoBurundiCabo VerdeCambodiaCameroonCanadaCaribbean small statesCentral African RepublicCentral Europe and the BalticsChadChileChinaColombiaComorosCongo, Dem. Rep.Congo, Rep.Costa RicaCote d'IvoireCroatiaCuracaoCyprusCzech RepublicDenmarkDjiboutiDominicaDominican RepublicEarly-demographic dividendEast Asia & PacificEast Asia & Pacific (excluding high income)East Asia & Pacific (IDA & IBRD countries)EcuadorEgypt, Arab Rep.El SalvadorEquatorial GuineaEritreaEstoniaEthiopiaEuro areaEurope & Central AsiaEurope & Central Asia (excluding high income)Europe & Central Asia (IDA & IBRD countries)European UnionFaroe IslandsFijiFinlandFragile and conflict affected situationsFranceFrench PolynesiaGabonGambia, TheGeorgiaGermanyGhanaGreeceGrenadaGuatemalaGuineaGuinea-BissauGuyanaHaitiHeavily indebted poor countries (HIPC)High incomeHondurasHong Kong SAR, ChinaHungaryIBRD onlyIcelandIDA & IBRD totalIDA blendIDA onlyIDA totalIndiaIndonesiaIran, Islamic Rep.IraqIrelandIsraelItalyJamaicaJapanJordanKazakhstanKenyaKiribatiKorea, Rep.KosovoKuwaitKyrgyz RepublicLao PDRLate-demographic dividendLatin America & Caribbean Latin America & Caribbean (excluding high income)Latin America & the Caribbean (IDA & IBRD countries)LatviaLeast developed countries: UN classificationLebanonLesothoLiberiaLibyaLithuaniaLow & middle incomeLow incomeLower middle incomeLuxembourgMacao SAR, ChinaMacedonia, FYRMadagascarMalawiMalaysiaMaldivesMaliMaltaMarshall IslandsMauritaniaMauritiusMexicoMicronesia, Fed. Sts.Middle East & North Africa (excluding high income)Middle East & North Africa (IDA & IBRD countries)Middle incomeMoldovaMongoliaMontenegroMoroccoMozambiqueMyanmarNamibiaNepalNetherlandsNew CaledoniaNicaraguaNigerNigeriaNorth AmericaNorwayOECD membersOmanOther small statesPacific island small statesPakistanPalauPanamaPapua New GuineaParaguayPeruPhilippinesPolandPortugalPost-demographic dividendPre-demographic dividendQatarRomaniaRussian FederationRwandaSamoaSao Tome and PrincipeSaudi ArabiaSenegalSerbiaSeychellesSierra LeoneSingaporeSint Maarten (Dutch part)Slovak RepublicSloveniaSmall statesSolomon IslandsSouth AfricaSouth AsiaSouth Asia (IDA & IBRD)South SudanSpainSri LankaSt. Kitts and NevisSt. LuciaSt. Vincent and the GrenadinesSub-Saharan Africa Sub-Saharan Africa (excluding high income)Sub-Saharan Africa (IDA & IBRD countries)SudanSurinameSwazilandSwedenSwitzerlandSyrian Arab RepublicTajikistanTanzaniaThailandTimor-LesteTogoTongaTrinidad and TobagoTunisiaTurkeyTuvaluUgandaUkraineUnited KingdomUnited StatesUpper middle incomeUruguayVanuatuVenezuela, RBVietnamWest Bank and GazaWorldYemen, Rep.ZambiaZimbabwe Timeline:
This timeline shows a graph from 1990 to 2016 of East Asia & Pacific. No data until 1989. Number of actual observations by date: 27.
Source name:
World Development Indicators
Source organization:
International Monetary Fund, Balance of Payments Statistics Yearbook and data files.
Categories, topics:
Economy & Growth, External Debt, Trade
Last updated:
apr 23, 2017
Indicators value changes by year
Minimum:
748.947 bln
jan 1, 1990
Maximum:
7.537 trl
jan 1, 2015
At the date of observation
Value
Absolute change
Change from previous value
jan 1, 1990
748.947 bln
+748.947 bln
0.0%
jan 1, 1991
830.198 bln
+81.251 bln
10.85%
jan 1, 1992
930.771 bln
+100.573 bln
12.11%
jan 1, 1993
1.035 trl
+104.167 bln
11.19%
jan 1, 1994
1.169 trl
+133.73 bln
12.92%
jan 1, 1995
1.374 trl
+205.737 bln
17.6%
jan 1, 1996
1.741 trl
+366.322 bln
26.65%
jan 1, 1997
1.88 trl
+138.829 bln
7.98%
jan 1, 1998
1.806 trl
-73.736 bln
-3.92%
jan 1, 1999
1.508 trl
-297.416 bln
-16.47%
jan 1, 2000
1.617 trl
+108.493 bln
7.19%
jan 1, 2001
1.95 trl
+333.022 bln
20.6%
jan 1, 2002
1.806 trl
-143.493 bln
-7.36%
jan 1, 2003
1.867 trl
+60.538 bln
3.35%
jan 1, 2004
2.262 trl
+395.466 bln
21.18%
jan 1, 2005
2.821 trl
+558.713 bln
24.7%
jan 1, 2006
3.291 trl
+469.853 bln
16.65%
jan 1, 2007
3.784 trl
+493.45 bln
14.99%
jan 1, 2008
4.383 trl
+598.647 bln
15.82%
jan 1, 2009
5.115 trl
+731.548 bln
16.69%
jan 1, 2010
4.247 trl
-867.347 bln
-16.96%
jan 1, 2011
5.475 trl
+1.228 trl
28.91%
jan 1, 2012
6.747 trl
+1.271 trl
23.22%
jan 1, 2013
7.12 trl
+373.236 bln
5.53%
jan 1, 2014
7.38 trl
+260.209 bln
3.65%
jan 1, 2015
7.537 trl
+156.816 bln
2.12%
jan 1, 2016
6.779 trl
-757.977 bln
-10.06%
Ranking of countries by current statistics by years


Comments: