29
/
en
AIzaSyAYiBZKx7MnpbEhh9jyipgxe19OcubqV5w
April 1, 2024
264731
Togo
TGO
true
2
1
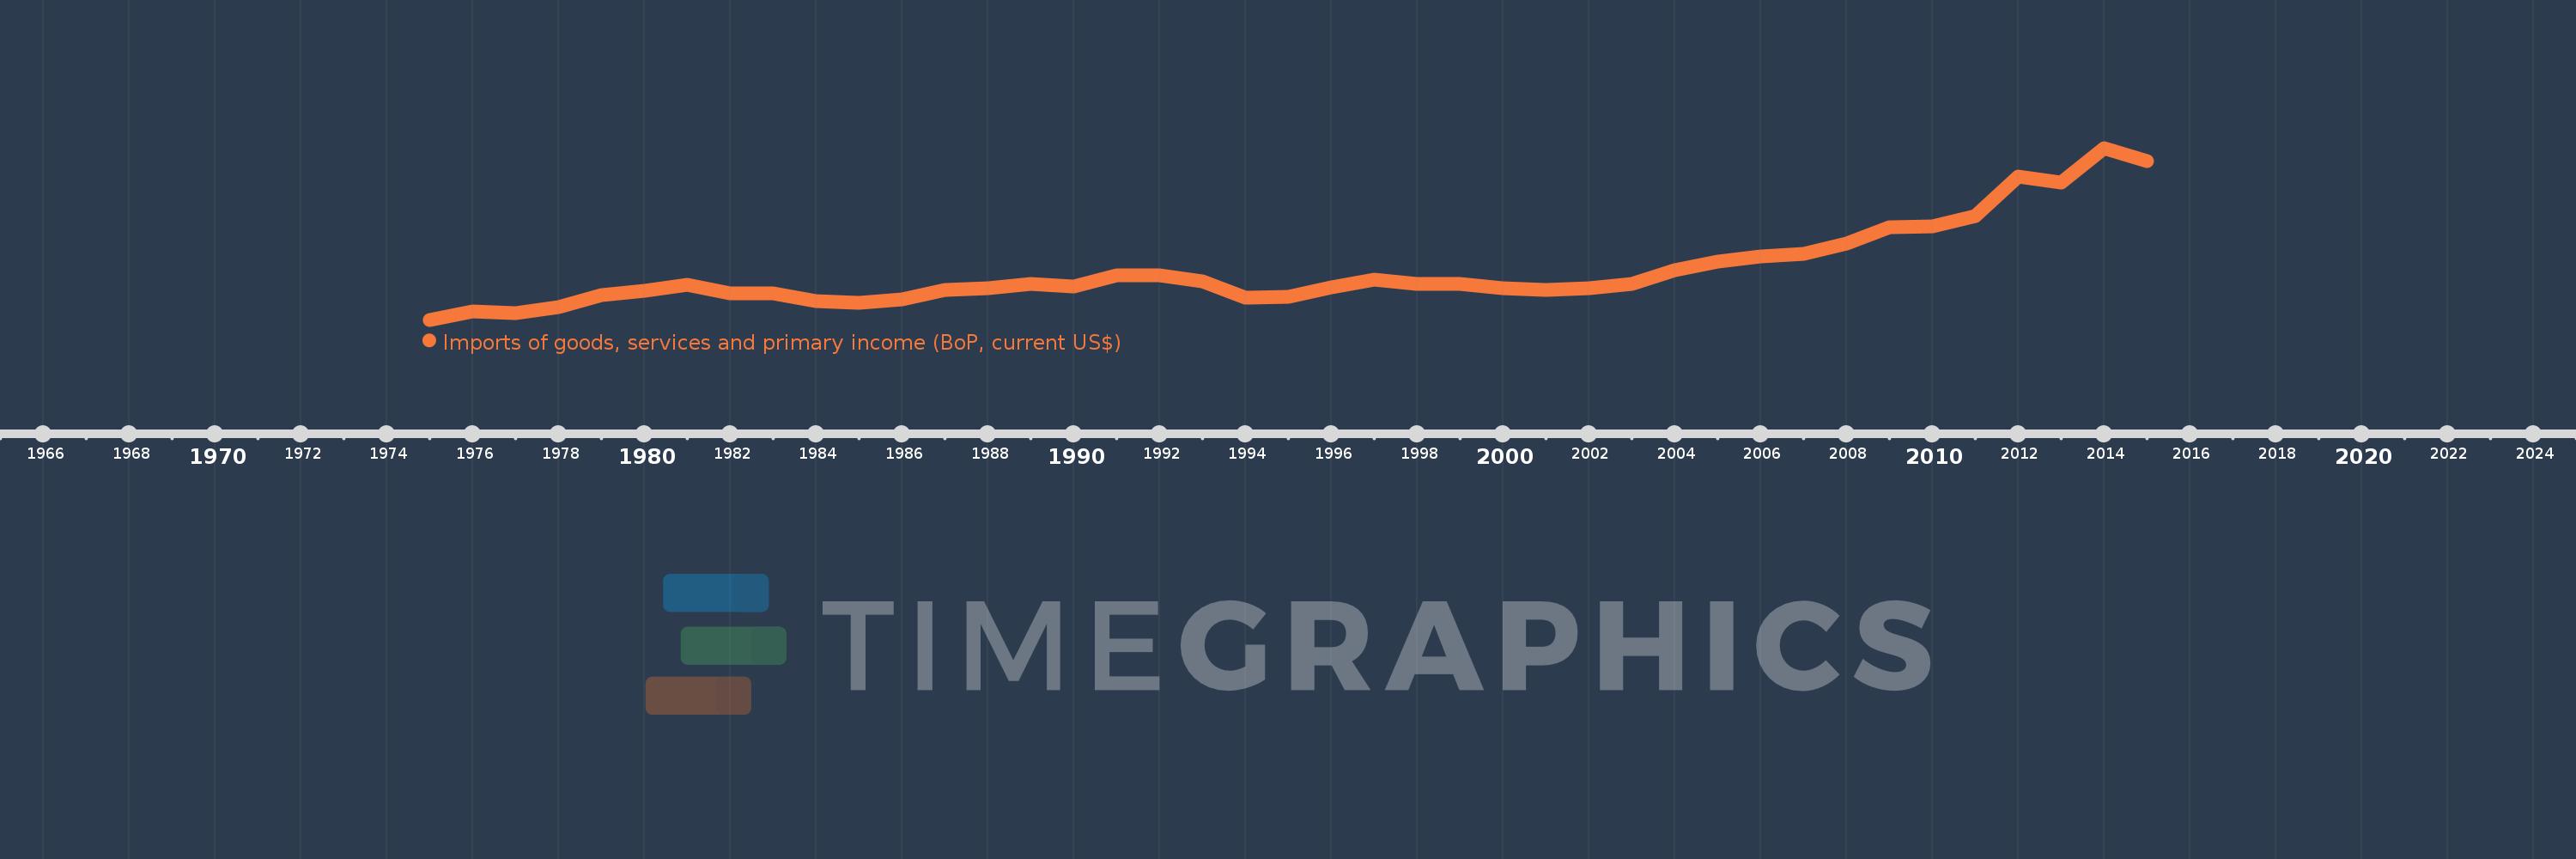
Imports of goods, services and primary income (BoP, current US$)
2015,2014,2013,2012,2011,2010,2009,2008,2007,2006,2005,2004,2003,2002,2001,2000,1999,1998,1997,1996,1995,1994,1993,1992,1991,1990,1989,1988,1987,1986,1985,1984,1983,1982,1981,1980,1979,1978,1977,1976,1975
This statistics in other country:
AfghanistanAlbaniaAlgeriaAngolaAntigua and BarbudaArab WorldArgentinaArmeniaArubaAustraliaAustriaAzerbaijanBahamas, TheBahrainBangladeshBarbadosBelarusBelgiumBelizeBeninBermudaBhutanBoliviaBosnia and HerzegovinaBotswanaBrazilBrunei DarussalamBulgariaBurkina FasoBurundiCabo VerdeCambodiaCameroonCanadaCaribbean small statesCentral African RepublicCentral Europe and the BalticsChadChileChinaColombiaComorosCongo, Dem. Rep.Congo, Rep.Costa RicaCote d'IvoireCroatiaCuracaoCyprusCzech RepublicDenmarkDjiboutiDominicaDominican RepublicEarly-demographic dividendEast Asia & PacificEast Asia & Pacific (excluding high income)East Asia & Pacific (IDA & IBRD countries)EcuadorEgypt, Arab Rep.El SalvadorEquatorial GuineaEritreaEstoniaEthiopiaEuro areaEurope & Central AsiaEurope & Central Asia (excluding high income)Europe & Central Asia (IDA & IBRD countries)European UnionFaroe IslandsFijiFinlandFragile and conflict affected situationsFranceFrench PolynesiaGabonGambia, TheGeorgiaGermanyGhanaGreeceGrenadaGuatemalaGuineaGuinea-BissauGuyanaHaitiHeavily indebted poor countries (HIPC)High incomeHondurasHong Kong SAR, ChinaHungaryIBRD onlyIcelandIDA & IBRD totalIDA blendIDA onlyIDA totalIndiaIndonesiaIran, Islamic Rep.IraqIrelandIsraelItalyJamaicaJapanJordanKazakhstanKenyaKiribatiKorea, Rep.KosovoKuwaitKyrgyz RepublicLao PDRLate-demographic dividendLatin America & Caribbean Latin America & Caribbean (excluding high income)Latin America & the Caribbean (IDA & IBRD countries)LatviaLeast developed countries: UN classificationLebanonLesothoLiberiaLibyaLithuaniaLow & middle incomeLow incomeLower middle incomeLuxembourgMacao SAR, ChinaMacedonia, FYRMadagascarMalawiMalaysiaMaldivesMaliMaltaMarshall IslandsMauritaniaMauritiusMexicoMicronesia, Fed. Sts.Middle East & North Africa (excluding high income)Middle East & North Africa (IDA & IBRD countries)Middle incomeMoldovaMongoliaMontenegroMoroccoMozambiqueMyanmarNamibiaNepalNetherlandsNew CaledoniaNicaraguaNigerNigeriaNorth AmericaNorwayOECD membersOmanOther small statesPacific island small statesPakistanPalauPanamaPapua New GuineaParaguayPeruPhilippinesPolandPortugalPost-demographic dividendPre-demographic dividendQatarRomaniaRussian FederationRwandaSamoaSao Tome and PrincipeSaudi ArabiaSenegalSerbiaSeychellesSierra LeoneSingaporeSint Maarten (Dutch part)Slovak RepublicSloveniaSmall statesSolomon IslandsSouth AfricaSouth AsiaSouth Asia (IDA & IBRD)South SudanSpainSri LankaSt. Kitts and NevisSt. LuciaSt. Vincent and the GrenadinesSub-Saharan Africa Sub-Saharan Africa (excluding high income)Sub-Saharan Africa (IDA & IBRD countries)SudanSurinameSwazilandSwedenSwitzerlandSyrian Arab RepublicTajikistanTanzaniaThailandTimor-LesteTogoTongaTrinidad and TobagoTunisiaTurkeyTuvaluUgandaUkraineUnited KingdomUnited StatesUpper middle incomeUruguayVanuatuVenezuela, RBVietnamWest Bank and GazaWorldYemen, Rep.ZambiaZimbabwe Timeline:
This timeline shows a graph from 1975 to 2015 of Togo. No data until 1974. Number of actual observations by date: 41.
Source name:
World Development Indicators
Source organization:
International Monetary Fund, Balance of Payments Statistics Yearbook and data files.
Categories, topics:
Economy & Growth, External Debt, Trade
Last updated:
apr 23, 2017
Indicators value changes by year
Minimum:
142.22 mln
jan 1, 1975
Maximum:
3.149 bln
jan 1, 2014
At the date of observation
Value
Absolute change
Change from previous value
jan 1, 1975
142.22 mln
+142.22 mln
0.0%
jan 1, 1976
291.956 mln
+149.736 mln
105.29%
jan 1, 1977
251.019 mln
-40.938 mln
-14.02%
jan 1, 1978
363.229 mln
+112.211 mln
44.7%
jan 1, 1979
572.775 mln
+209.546 mln
57.69%
jan 1, 1980
641.74 mln
+68.965 mln
12.04%
jan 1, 1981
751.521 mln
+109.781 mln
17.11%
jan 1, 1982
603.29 mln
-148.23 mln
-19.72%
jan 1, 1983
603.19 mln
-100.503K
-0.02%
jan 1, 1984
468.74 mln
-134.45 mln
-22.29%
jan 1, 1985
431.764 mln
-36.977 mln
-7.89%
jan 1, 1986
497.085 mln
+65.322 mln
15.13%
jan 1, 1987
660.353 mln
+163.267 mln
32.84%
jan 1, 1988
699.782 mln
+39.429 mln
5.97%
jan 1, 1989
775.116 mln
+75.335 mln
10.77%
jan 1, 1990
729.787 mln
-45.33 mln
-5.85%
jan 1, 1991
912.094 mln
+182.307 mln
24.98%
jan 1, 1992
911.92 mln
-173.468K
-0.02%
jan 1, 1993
809.258 mln
-102.662 mln
-11.26%
jan 1, 1994
521.178 mln
-288.081 mln
-35.6%
jan 1, 1995
544.821 mln
+23.643 mln
4.54%
jan 1, 1996
713.095 mln
+168.274 mln
30.89%
jan 1, 1997
841.22 mln
+128.125 mln
17.97%
jan 1, 1998
762.274 mln
-78.946 mln
-9.38%
jan 1, 1999
770.446 mln
+8.172 mln
1.07%
jan 1, 2000
698.562 mln
-71.884 mln
-9.33%
jan 1, 2001
664.132 mln
-34.43 mln
-4.93%
jan 1, 2002
701.207 mln
+37.076 mln
5.58%
jan 1, 2003
771.222 mln
+70.015 mln
9.98%
jan 1, 2004
1.009 bln
+237.709 mln
30.82%
jan 1, 2005
1.167 bln
+158.216 mln
15.68%
jan 1, 2006
1.249 bln
+81.833 mln
7.01%
jan 1, 2007
1.299 bln
+49.777 mln
3.99%
jan 1, 2008
1.469 bln
+170.172 mln
13.1%
jan 1, 2009
1.763 bln
+293.656 mln
19.99%
jan 1, 2010
1.777 bln
+14.741 mln
0.84%
jan 1, 2011
1.951 bln
+173.954 mln
9.79%
jan 1, 2012
2.651 bln
+699.975 mln
35.87%
jan 1, 2013
2.541 bln
-110.077 mln
-4.15%
jan 1, 2014
3.149 bln
+607.562 mln
23.91%
jan 1, 2015
2.919 bln
-229.797 mln
-7.3%
Ranking of countries by current statistics by years


Comments: